Search icon CANCEL
Subscription
0
Cart icon
Your Cart (0 item)
Close icon
You have no products in your basket yet
Save more on your purchases! discount-offer-chevron-icon
Savings automatically calculated. No voucher code required.
Arrow left icon
Explore Products
Best Sellers
New Releases
Books
Videos
Audiobooks
Learning Hub
Free Learning
Arrow right icon
Arrow up icon
GO TO TOP
Getting Started with Kubernetes, Second Edition

You're reading from   Getting Started with Kubernetes, Second Edition Orchestrate and manage large-scale Docker deployments

Arrow left icon
Product type Paperback
Published in May 2017
Publisher Packt
ISBN-13 9781787283367
Length 286 pages
Edition 2nd Edition
Tools
Arrow right icon
Author (1):
Arrow left icon
Jonathan Baier Jonathan Baier
Author Profile Icon Jonathan Baier
Jonathan Baier
Arrow right icon
View More author details
Toc

Table of Contents (13) Chapters Close

Preface 1. Introduction to Kubernetes FREE CHAPTER 2. Pods, Services, Replication Controllers, and Labels 3. Networking, Load Balancers, and Ingress 4. Updates, Gradual Rollouts, and Autoscaling 5. Deployments, Jobs, and DaemonSets 6. Storage and Running Stateful Applications 7. Continuous Delivery 8. Monitoring and Logging 9. Cluster Federation 10. Container Security 11. Extending Kubernetes with OCP, CoreOS, and Tectonic 12. Towards Production Ready

Our first cluster

Kubernetes is supported on a variety of platforms and OSes. For the examples in this book, I used an Ubuntu 16.04 Linux VirtualBox for my client and Google Compute Engine (GCE) with Debian for the cluster itself. We will also take a brief look at a cluster running on Amazon Web Services (AWS) with Ubuntu.

To save some money, both GCP and AWS offer free tiers and trial offers for their cloud infrastructure. It's worth using these free trials for your Kubernetes learning, if possible.
Most of the concepts and examples in this book should work on any installation of a Kubernetes cluster. To get more information on other platform setups, refer to the Kubernetes getting started page on the following GitHub link: 
http://kubernetes.io/docs/getting-started-guides/

First, let's make sure that our environment is properly set up before we install Kubernetes. Start by updating packages:

$ sudo apt-get update

Install Python and curl if they are not present:

$ sudo apt-get install python
$ sudo apt-get install curl

Install the gcloud SDK:

$ curl https://sdk.cloud.google.com | bash
We will need to start a new shell before gcloud is on our path.

Configure your Google Cloud Platform (GCP) account information. This should automatically open a browser from where we can log in to our Google Cloud account and authorize the SDK:

$ gcloud auth login
If you have problems with login or want to use another browser, you can optionally use the --no-launch-browser command. Copy and paste the URL to the machine and/or browser of your choice. Log in with your Google Cloud credentials and click Allow on the permissions page. Finally, you should receive an authorization code that you can copy and paste back into the shell where the prompt is waiting.

A default project should be set, but we can verify this with the following command:

$ gcloud config list project

We can modify this and set a new default project with this command. Make sure to use project ID and not project name, as follows:

$ gcloud config set project <PROJECT ID>
We can find our project ID in the console at the following URL:
https://console.developers.google.com/project
Alternatively, we can list active projects:
$ gcloud alpha projects list

Now that we have our environment set up, installing the latest Kubernetes version is done in a single step, as follows:

$ curl -sS https://get.k8s.io | bash

It may take a minute or two to download Kubernetes depending on your connection speed. Earlier versions would automatically call the kube-up.sh script and start building our cluster. In version 1.5, we will need to call the kube-up.sh script ourselves to launch the cluster. By default, it will use the Google Cloud and GCE:

$ kubernetes/cluster/kube-up.sh

After you run the kube-up.sh script, we will see quite a few lines roll past. Let's take a look at them one section at a time:

GCE prerequisite check
If your gcloud components are not up to date, you may be prompted to update them.

The preceding image, GCE prerequisite check, shows the checks for prerequisites as well as making sure that all components are up to date. This is specific to each provider. In the case of GCE, it will verify that the SDK is installed and that all components are up to date. If not, you will see a prompt at this point to install or update:
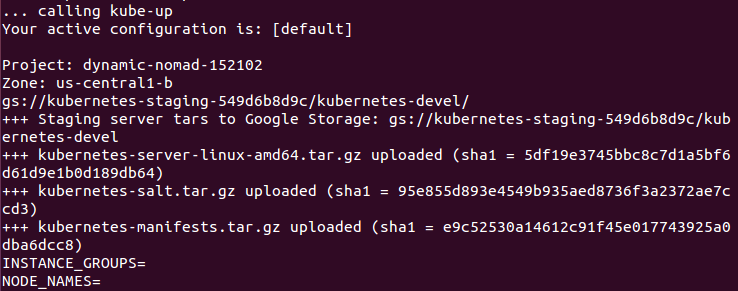
Upload cluster packages

Now the script is turning up the cluster. Again, this is specific to the provider. For GCE, it first checks to make sure that the SDK is configured for a default project and zone. If they are set, you'll see those in the output.

Next, it uploads the server binaries to Google Cloud storage, as seen in the Creating gs:... lines:
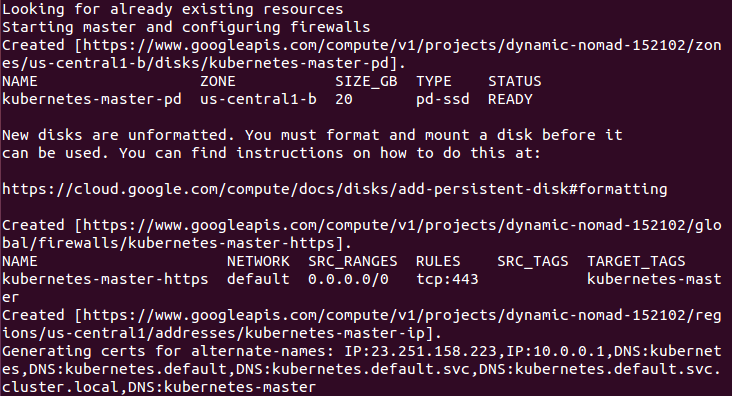
Master creation

It then checks for any pieces of a cluster already running. Then, we finally start creating the cluster. In the output in the preceding figure Master creation, we see it creating the master server, IP address, and appropriate firewall configurations for the cluster:
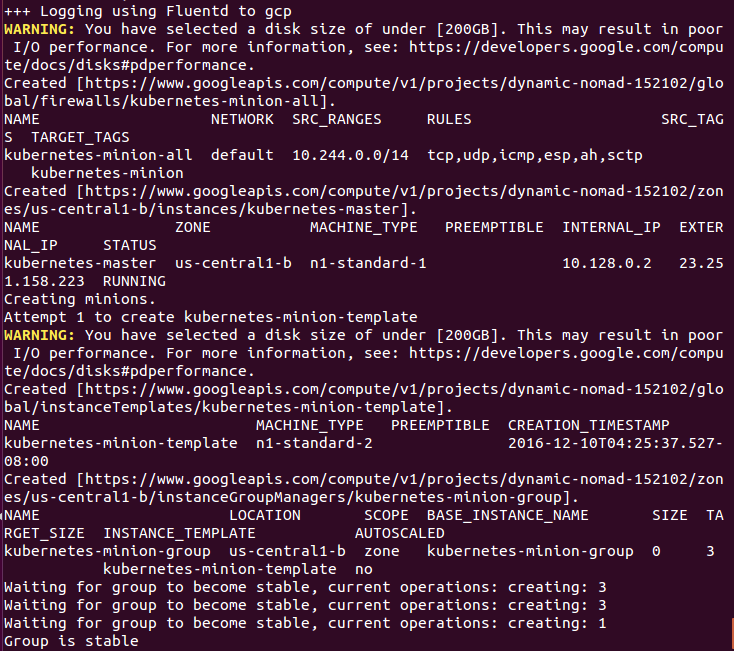
Minion creation

Finally, it creates the minions or nodes for our cluster. This is where our container workloads will actually run. It will continually loop and wait while all the minions start up. By default, the cluster will have four nodes (minions), but K8s supports having more than 1000 (and soon beyond). We will come back to scaling the nodes later on in the book.
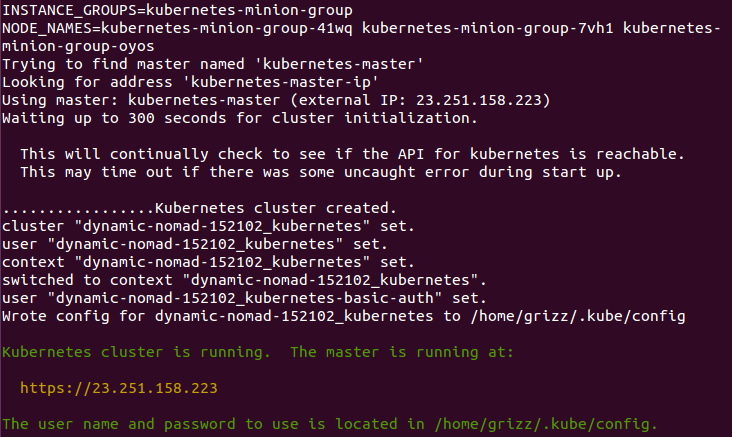
Cluster completion

Now that everything is created, the cluster is initialized and started. Assuming that everything goes well, we will get an IP address for the master. Also, note that configuration along with the cluster management credentials are stored in home/<Username>/.kube/config:
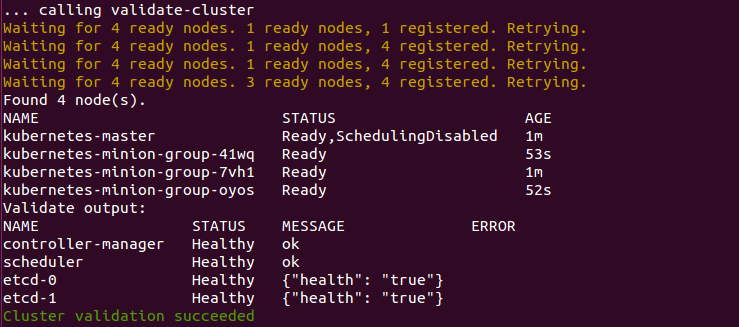
Cluster validation

Then, the script will validate the cluster. At this point, we are no longer running provider-specific code. The validation script will query the cluster via the kubectl.sh script. This is the central script for managing our cluster. In this case, it checks the number of minions found, registered, and in a ready state. It loops through giving the cluster up to 10 minutes to finish initialization.

After a successful startup, a summary of the minions and the cluster component health is printed on the screen:
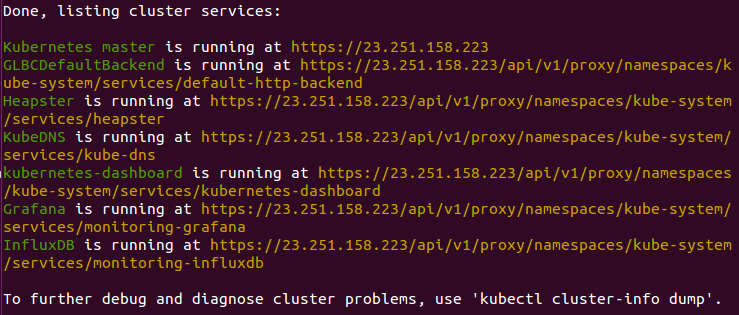
Cluster summary

Finally, a kubectl cluster-info command is run, which outputs the URL for the master services including DNS, UI, and monitoring. Let's take a look at some of these components.

Kubernetes UI

Open a browser and run the following code:

https://<your master ip>/ui/

The certificate is self-signed by default, so you'll need to ignore the warnings in your browser before proceeding. After this, we will see a login dialog. This is where we use the credentials listed during the K8s installation. We can find them at any time by simply using the config command:

$ kubectl config view

Now that we have credentials for login, use those, and we should see a dashboard like the following image:

Kubernetes UI dashboard

The main dashboard takes us to a page with not much display at first. There is a link to deploy a containerized app that will take you to a GUI for deployment. This GUI can be a very easy way to get started deploying apps without worrying about the YAML syntax for Kubernetes. However, as your use of containers matures, it's good practice to use the YAML definitions that are checked in to source control.

If you click on the Nodes link on the left-hand side menu, you will see some metrics on the current cluster nodes:


Kubernetes Node Dashboard

At the top, we see an aggregate of the CPU and memory usages followed by a listing of our cluster nodes. Clicking on one of the nodes will take us to a page with detailed information about that node, its health, and various metrics.

The Kubernetes UI has a lot of other views that will become more useful as we start launching real applications and adding configurations to the cluster.

Grafana

Another service installed by default is Grafana. This tool will give us a dashboard to view metrics on the cluster nodes. We can access it using the following syntax in a browser: https://<your master ip>/api/v1/proxy/namespaces/kube-system/services/monitoring-grafana

Kubernetes Grafana dashboard

From the main page, click on the Home dropdown and select Cluster. Here, Kubernetes is actually running a number of services. Heapster is used to collect the resource usage on the pods and nodes and stores the information in InfluxDB. The results, such as CPU and memory usage, are what we see in the Grafana UI. We will explore this in depth in Chapter 8, Monitoring and Logging.

Command line

The kubectl script has commands to explore our cluster and the workloads running on it. You can find it in the /kubernetes/client/bin folder. We will be using this command throughout the book, so let's take a second to set up our environment. We can do so by putting the binaries folder on our PATH, in the following manner:

$ export PATH=$PATH:/<Path where you downloaded K8s>/kubernetes/client/bin
$ chmod +x /<Path where you downloaded K8s>/kubernetes/client/bin
You may choose to download the kubernetes folder outside your home folder, so modify the preceding command as appropriate.
It is also a good idea to make the changes permanent by adding the export command to the end of your .bashrc file in your home directory.

Now that we have kubectl on our path, we can start working with it. It has quite a few commands. Since we have not spun up any applications yet, most of these commands will not be very interesting. However, we can explore with two commands right away.

First, we have already seen the cluster-info command during initialization, but we can run it again at any time with the following command:

$ kubectl cluster-info

Another useful command is get. It can be used to see currently running services, pods, replication controllers, and a lot more. Here are the three examples that are useful right out of the gate:

  • List the nodes in our cluster:
    $ kubectl get nodes
  • List cluster events:
    $ kubectl get events
  • Finally, we can see any services that are running in the cluster, as follows:
    $ kubectl get services

To start with, we will only see one service, named kubernetes. This service is the core API server for the cluster.

Services running on the master

Let's dig a little bit deeper into our new cluster and its core services. By default, machines are named with the kubernetes- prefix. We can modify this using $KUBE_GCE_INSTANCE_PREFIX before a cluster is spun up. For the cluster we just started, the master should be named kubernetes-master. We can use the gcloud command-line utility to SSH into the machine. The following command will start an SSH session with the master node. Be sure to substitute your project ID and zone to match your environment. Also, note that you can launch SSH from the Google Cloud console using the following syntax:

$ gcloud compute ssh --zone "<your gce zone>" "kubernetes-master"
If you have trouble with SSH via the Google Cloud CLI, you can use the Console which has a built-in SSH client. Simply go to the VM instances page and you'll see an SSH option as a column in the kubernetes-master listing. Alternatively, the VM instance details page has the SSH option at the top.

Once we are logged in, we should get a standard shell prompt. Let's run the docker command that filters for Image and Status:

$ sudo docker ps --format 'table {{.Image}}t{{.Status}}' 
Master container listing

Even though we have not deployed any applications on Kubernetes yet, we note that there are several containers already running. The following is a brief description of each container:

  • fluentd-gcp: This container collects and sends the cluster logs file to the Google Cloud Logging service.
  • node-problem-detector: This container is a daemon that runs on every node and currently detects issues at the hardware and kernel layer.
  • rescheduler: This is another add-on container that makes sure critical components are always running. In cases of low resources availability, it may even remove less critical pods to make room.
  • glbc: This is another Kubernetes add-on container that provides Google Cloud Layer 7 load balancing using the new Ingress capability.
  • kube-addon-manager: This component is core to the extension of Kubernetes through various add-ons. It also periodically applies any changes to  the /etc/kubernetes/addons directory.
  • etcd-empty-dir-cleanup: A utility to cleanup empty keys in etcd.
  • kube-controller-manager: This is a controller manager that controls a variety of cluster functions, ensuring accurate and up-to-date replication is one of its vital roles. Additionally, it monitors, manages, and discovers new nodes. Finally, it manages and updates service endpoints.
  • kube-apiserver: This container runs the API server. As we explored in the Swagger interface, this RESTful API allows us to create, query, update, and remove various components of our Kubernetes cluster.
  • kube-scheduler: This scheduler takes unscheduled pods and binds them to nodes based on the current scheduling algorithm.
  • etcd: This runs the etcd software built by CoreOS, and it is a distributed and consistent key-value store. This is where the Kubernetes cluster state is stored, updated, and retrieved by various components of K8s.
  • pause: This container is often referred to as the pod infrastructure container and is used to set up and hold the networking namespace and resource limits for each pod.
I omitted the amd64 for many of these names to make this more generic. The purpose of the pods remains the same.

To exit the SSH session, simply type exit at the prompt.

In the next chapter, we will also show how a few of these services work together in the first image, Kubernetes core architecture.

Services running on the minions

We could SSH to one of the minions, but since Kubernetes schedules workloads across the cluster, we would not see all the containers on a single minion. However, we can look at the pods running on all the minions using the kubectl command:

$ kubectl get pods

Since we have not started any applications on the cluster yet, we don't see any pods. However, there are actually several system pods running pieces of the Kubernetes infrastructure. We can see these pods by specifying the kube-system namespace. We will explore namespaces and their significance later, but for now, the --namespace=kube-system command can be used to look at these K8s system resources, as follows:

$ kubectl get pods --namespace=kube-system

We should see something similar to the following:

etcd-empty-dir-cleanup-kubernetes-master 
etcd-server-events-kubernetes-master
etcd-server-kubernetes-master
fluentd-cloud-logging-kubernetes-master
fluentd-cloud-logging-kubernetes-minion-group-xxxx
heapster-v1.2.0-xxxx
kube-addon-manager-kubernetes-master
kube-apiserver-kubernetes-master
kube-controller-manager-kubernetes-master
kube-dns-xxxx
kube-dns-autoscaler-xxxx
kube-proxy-kubernetes-minion-group-xxxx
kube-scheduler-kubernetes-master
kubernetes-dashboard-xxxx
l7-default-backend-xxxx
l7-lb-controller-v0.8.0-kubernetes-master
monitoring-influxdb-grafana-xxxx
node-problem-detector-v0.1-xxxx
rescheduler-v0.2.1-kubernetes-master

The first six lines should look familiar. Some of these are the services we saw running on the master and will see pieces of these on the nodes. There are a few additional services we have not seen yet. The kube-dns option provides the DNS and service discovery plumbing, kubernetes-dashboard-xxxx is the user interface for Kubernetes, l7-default-backend-xxxx provides the default load balancing backend for the new Layer-7 load balancing capability, and heapster-v1.2.0-xxxx and monitoring-influx-grafana provide the Heapster database and user interface to monitor resource usage across the cluster. Finally, kube-proxy-kubernetes-minion-group-xxxx  is the proxy which directs traffic to the proper backing services and pods running on our cluster.

If we did SSH into a random minion, we would see several containers that run across a few of these pods. A sample might look like this image:

Minion container listing

Again, we saw a similar line up of services on the master. The services we did not see on the master include the following:

  • kubedns: This container monitors the service and endpoint resources in Kubernetes and synchronizes any changes to DNS lookups.
  • kube-dnsmasq: This is another container that provides DNS caching.
  • dnsmasq-metrics: This provides metric reporting for DNS services in cluster.
  • l7-defaultbackend: This is the default backend for handling the GCE L7 load balancer and Ingress.
  • kube-proxy: This is the network and service proxy for your cluster. This component makes sure service traffic is directed to wherever your workloads are running on the cluster. We will explore this in more depth later in the book.
  • heapster: This container is for monitoring and analytics.
  • addon-resizer: This cluster utility is for scaling containers.
  • heapster_grafana: This does resource usage and monitoring.
  • heapster_influxdb: This time-series database is for Heapster data.
  • cluster-proportional-autoscaler: This cluster utility is for scaling containers in proportion to the cluster size.
  • exechealthz: This performs health checks on the pods.
Again, I have omitted the amd64 for many of these names to make this more generic. The purpose of the pods remains the same.

Tear down cluster

Alright, this is our first cluster on GCE, but let's explore some other providers. To keep things simple, we need to remove the one we just created on GCE. We can tear down the cluster with one simple command:

$ kube-down.sh
You have been reading a chapter from
Getting Started with Kubernetes, Second Edition - Second Edition
Published in: May 2017
Publisher: Packt
ISBN-13: 9781787283367
Register for a free Packt account to unlock a world of extra content!
A free Packt account unlocks extra newsletters, articles, discounted offers, and much more. Start advancing your knowledge today.
Unlock this book and the full library FREE for 7 days
Get unlimited access to 7000+ expert-authored eBooks and videos courses covering every tech area you can think of
Renews at $19.99/month. Cancel anytime
Banner background image