


Connecting to a Data Source
For any visualization, you need to have an underlying data source that contains all the information you wish to show. This is the first step of any data visualization task.
The very first thing that you will see when you open Tableau Desktop is the Connect pane. Here, you can connect to a variety of data sources and perform various tasks related to data handling, which you will study in this chapter. The following figure shows the screen that comes up when you start Tableau Desktop:
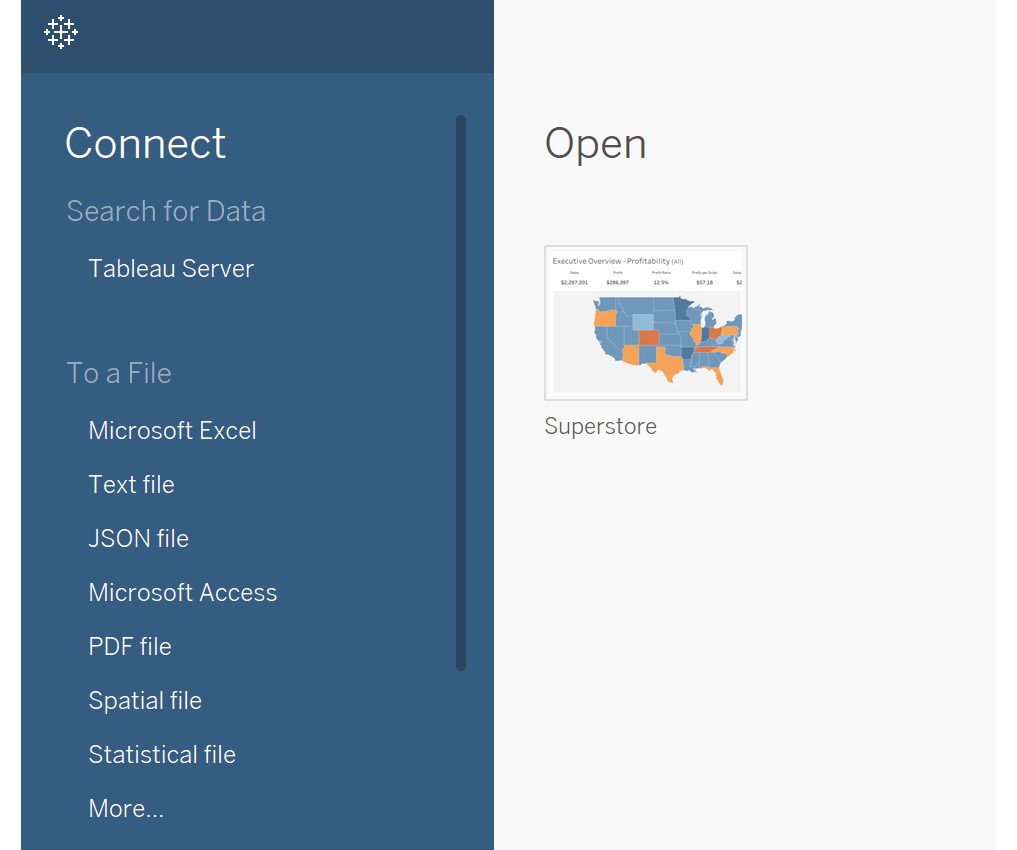
Figure 2.1: Start screen on launching Tableau Desktop
Depending on the version, this screen might look slightly different, but it should remain this way for the most part: you can observe that you can connect to multiple file options such as Excel, text, and JSON files. You can also connect to server-based data sources such as MySQL and Oracle. Saved Data Sources provides sample data sources that are available with Tableau Desktop.
In the following exercise, you will connect to an Excel file named Sample - Superstore, which is available with Tableau Desktop. This file contains an Orders sheet, which consists of information for various orders, based on attributes such as order ID, order category, ship mode, and customer details. It also has a Returns sheet, which consists of orders that were returned. You will use all of this data to perform various operations throughout this chapter, and visualize the data in Tableau Desktop.
Exercise 2.01: Connecting to an Excel File
In this exercise, you will connect to your very first data source in Tableau, the Sample - Superstore Excel file. This file is automatically accessible to you if you have installed Tableau as mentioned in Chapter 1, Introduction to Tableau. It contains three sheets, comprising order-level information stored in the Orders sheet, customer information stored in the People sheet, and order returns stored in the Returns sheet, and can be quickly downloaded from the GitHub repository for this chapter at https://packt.link/14u86. Make sure to download this file on your system before proceeding with the exercise.
Perform the following steps to complete this exercise:
- Under the
Connectpane, select theMicrosoft Exceloption.
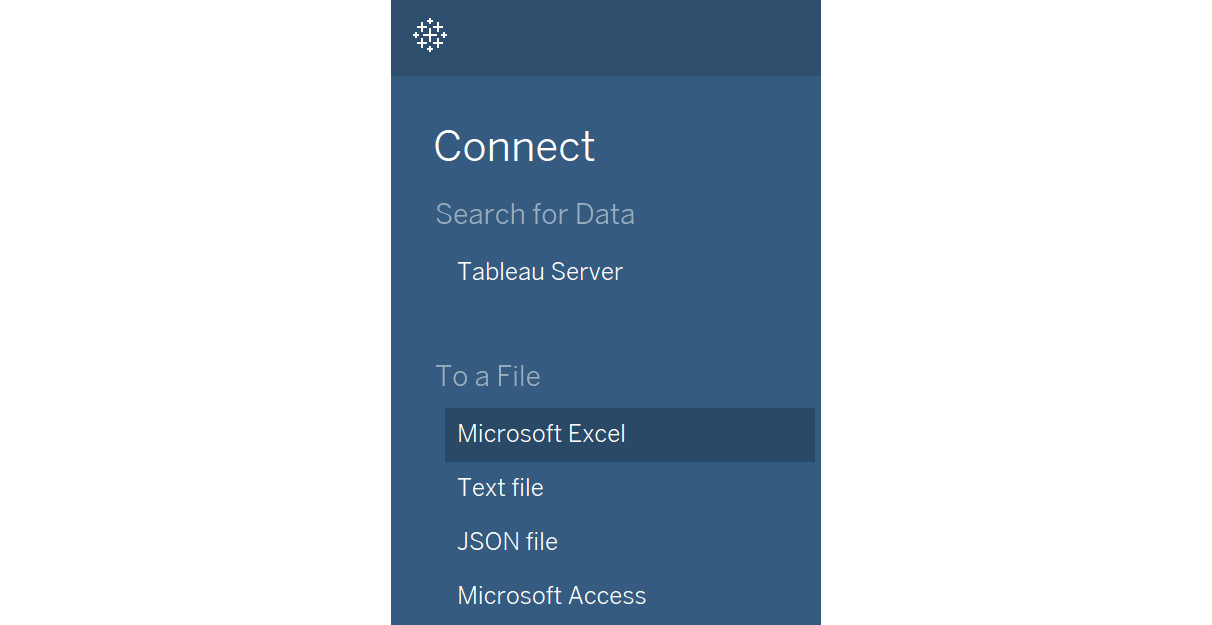
Figure 2.2: Connecting to Microsoft Excel
- This will open up the file menu where you can select the Excel file from the file explorer. Navigate to the location where you have saved this file locally and then select to open the
Sample-Superstore.xlsfile. You will see the following screen once the file is loaded:
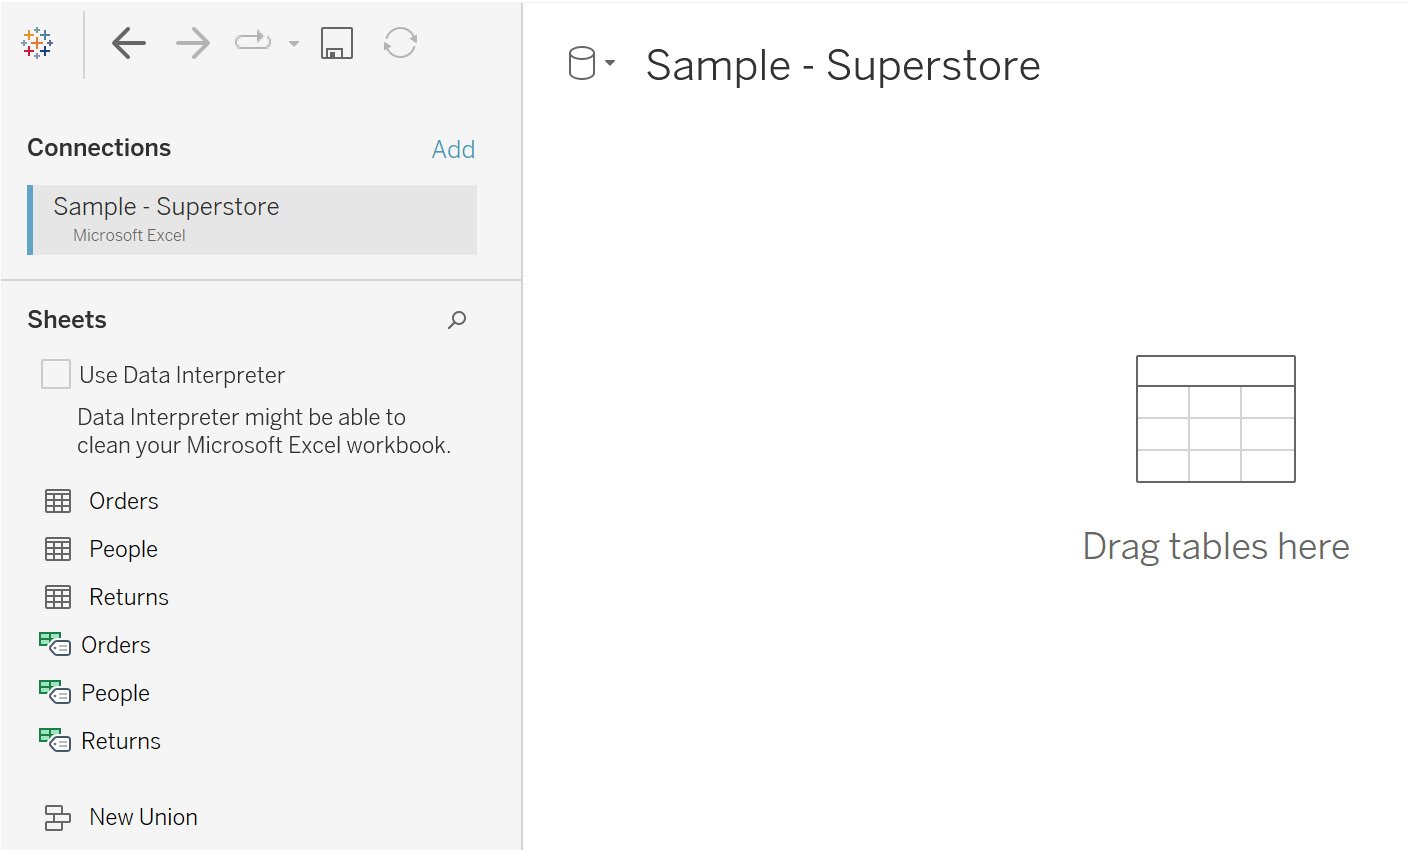
Figure 2.3: File import screen
- Hover over the table to get the
View dataoption (as highlighted in the following figure) and preview the data:
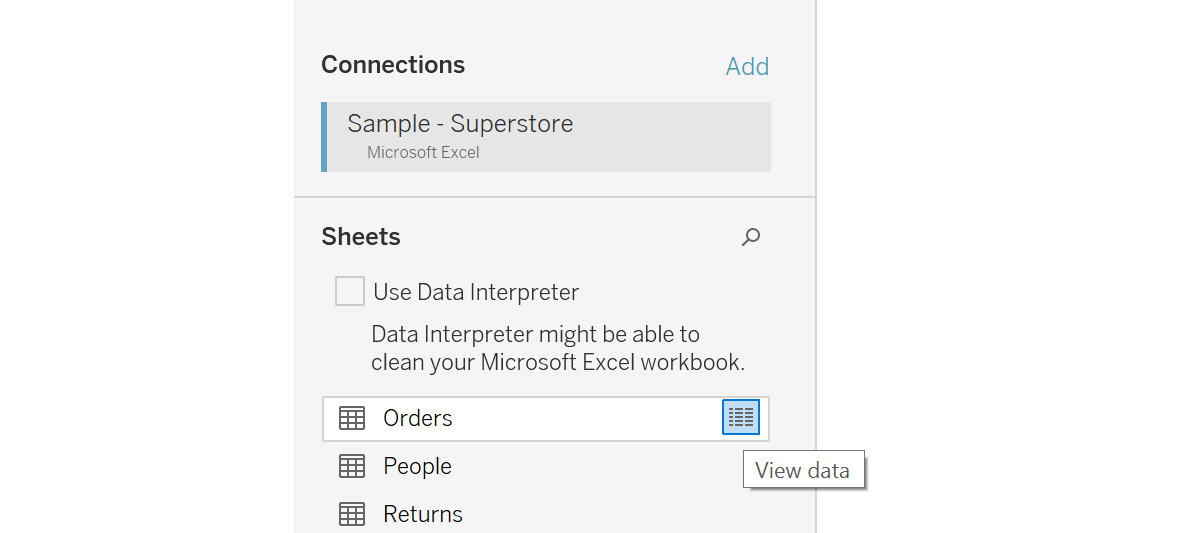
Figure 2.4: View data for the underlying sheet
The following figure shows the data preview:
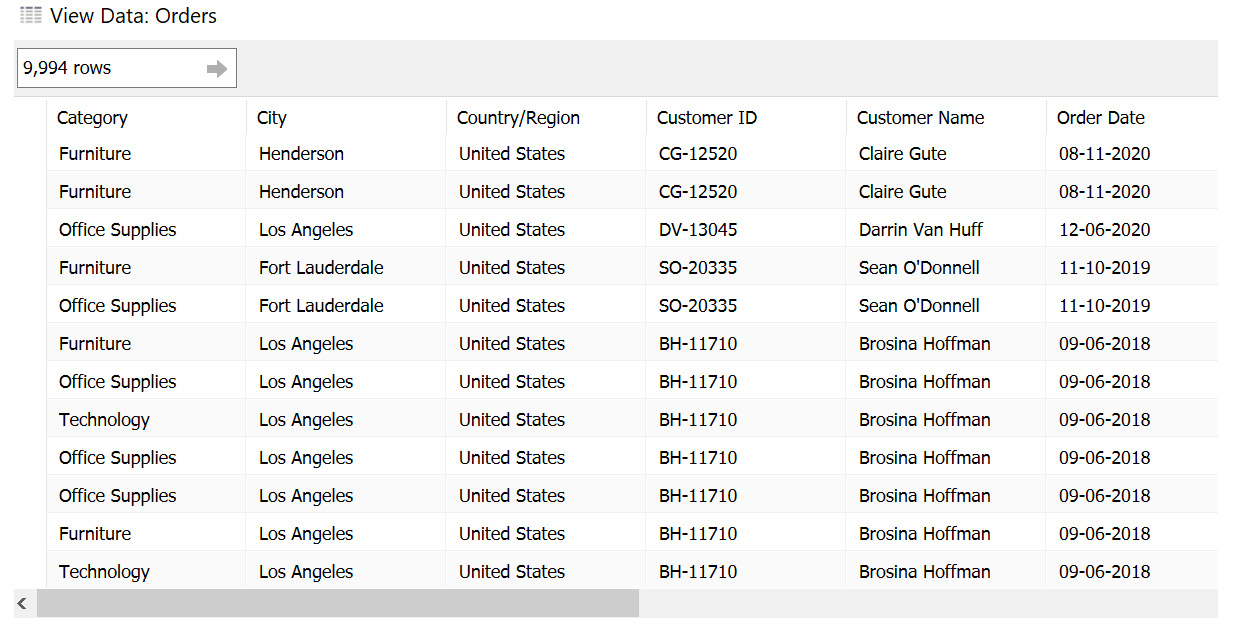
Figure 2.5: View Data window showing the data preview
- Now, drag the
Orderssheet onto theDrag sheets herearea. This is also known as the canvas. - The sheet should now have been imported into Tableau. Preview the data, as shown in the following figure:
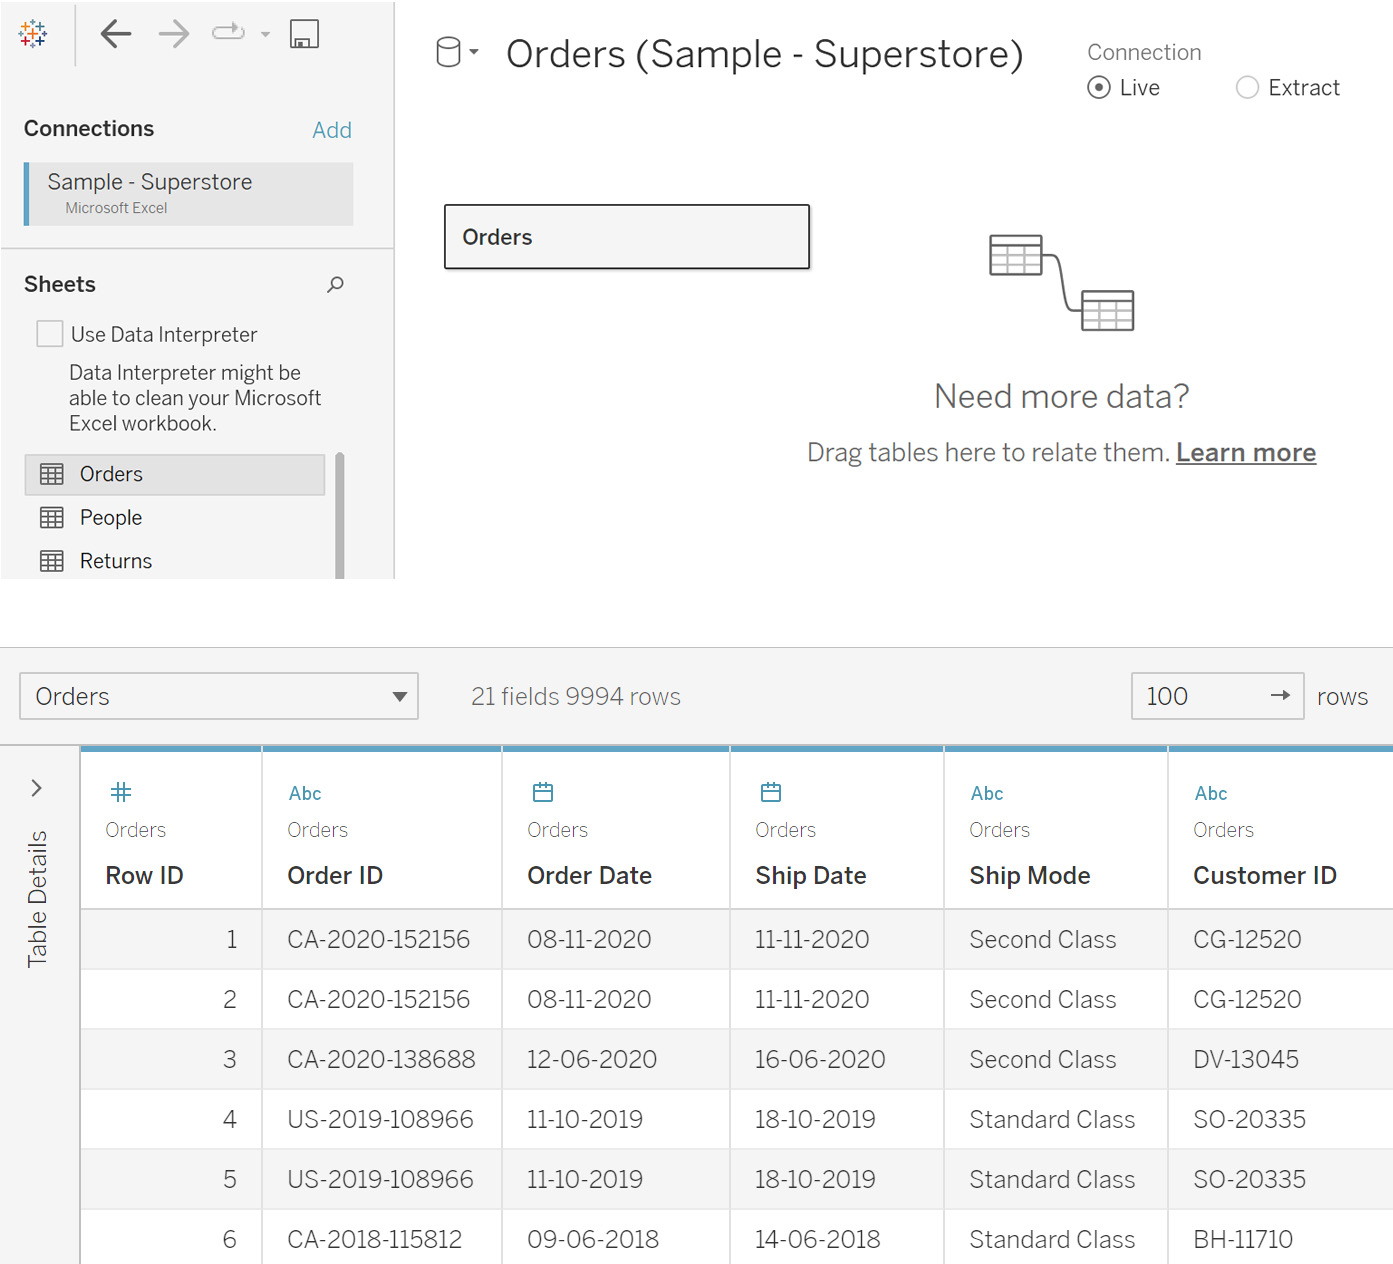
Figure 2.6: Data preview of the imported sheet
You have thus connected and imported the data in Tableau.
- Hovering over
Sheet 1, you can see the activeGo to Worksheetoption, which means that you can navigate toSheet 1and start creating visualizations.

Figure 2.7: Go to Worksheet popup
Once the data is imported, you can start the visualization development by clicking on that option, as you will see later in the course.
In this exercise, you saw how you can connect to an Excel file. Tableau also allows you to connect to data that is stored on servers. In the next section, you will learn how this can be done.
Connecting to a Server Data Source
Here, you will be connecting with Microsoft SQL Server, available under the server-based data sources. Note that the concept of installing and maintaining server-based data sources is beyond the scope of this chapter. However, ideally, in a business project, data would mostly be stored on servers. For this reason, it is important to know how to connect to these data sources.
The following steps will help you connect to a server-based data source:
- Under the
Connectpane, select theMicrosoft SQL Serveroption, as can be seen in the following figure:
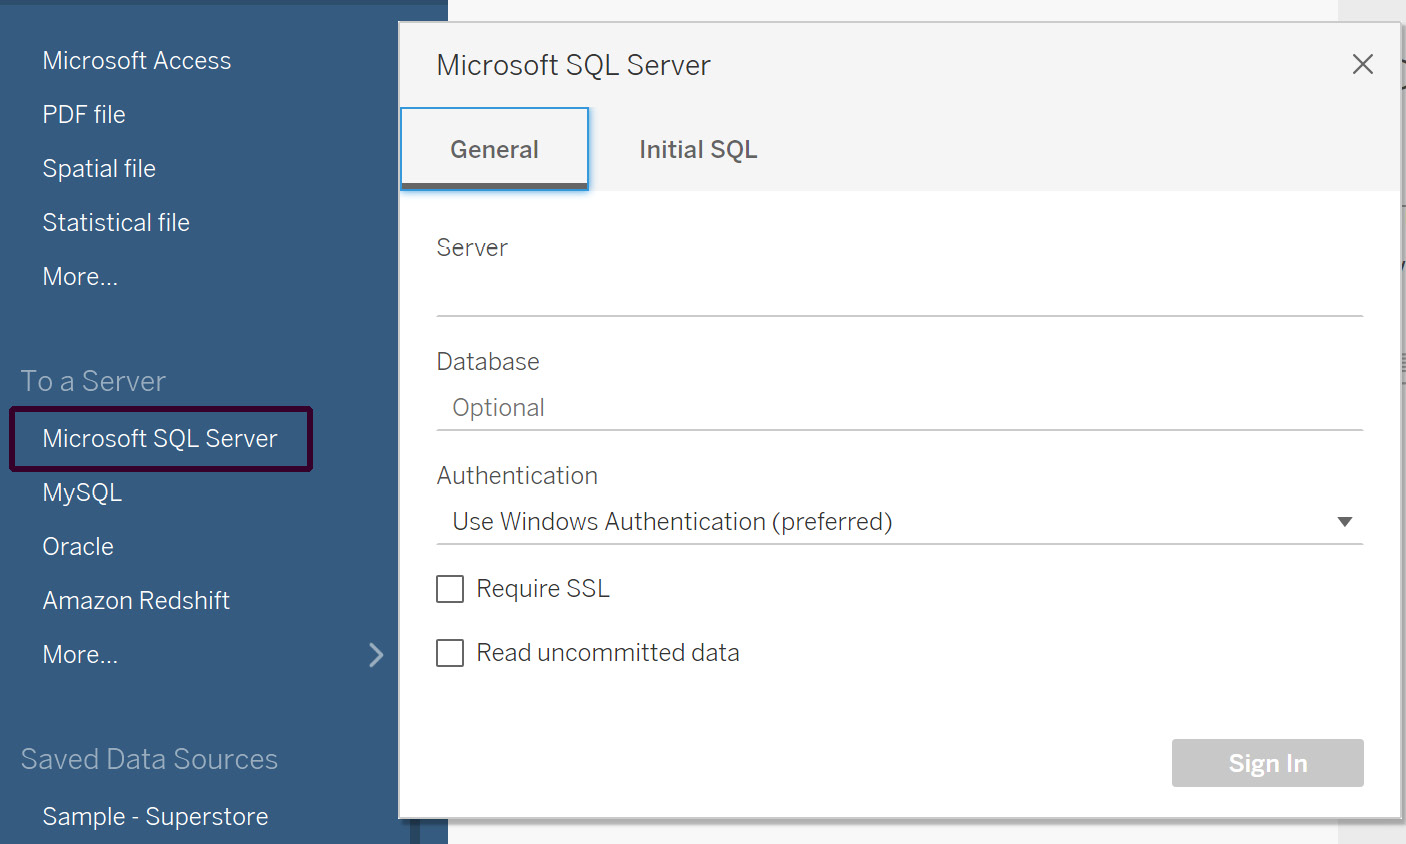
Figure 2.8: Server connection input screen
Here, you need to enter the information required, such as the server name and the authentication method. These details would be available from your database administrator.
- Click
Sign In. You will get a similar preview screen as you saw in Figure 2.5. All the steps afterward are the same as you do for an Excel-based connection.Note
One of the most commonly occurring issues here is that sometimes the drivers to connect to the data source are not installed. This can be easily resolved by downloading and installing the drivers from https://www.tableau.com/support/drivers.
In this section, you connected to a server-based data source. The next section covers the different kinds of joins in Tableau to combine the data from multiple data sources.


