


Creating a text table (crosstab)
A text table is also often referred to as a crosstab, a shortened term for cross tabulation. Another common term that can be used to describe text tables is a spreadsheet. A text table is a series of rows and columns that have headers and numeric values. Text tables are great when the audience requires to see the individual values. A limitation of text tables is that it requires attentive processing—whoever is using the text table needs to focus on reading and comparing the numbers because any patterns or insights are not very easy to spot.
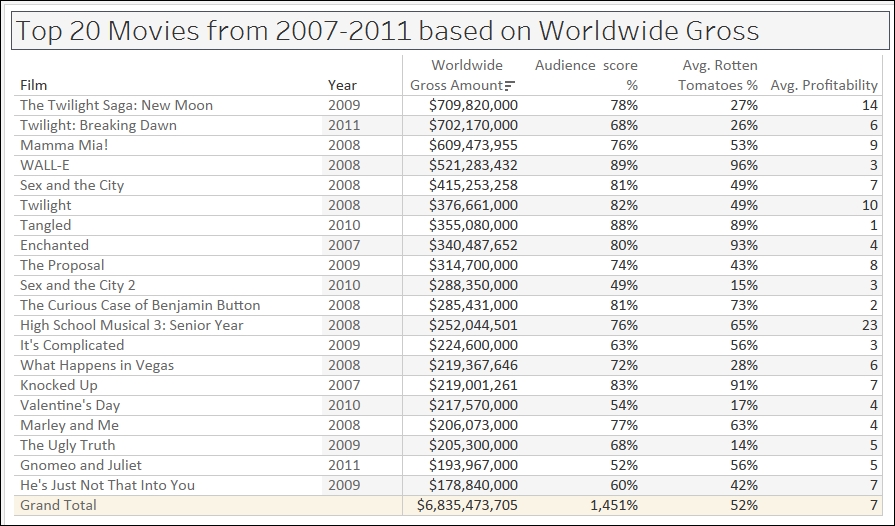
In this recipe, we will create a text table that shows the top 20 movies from 2007-2011, based on the worldwide gross amount.
Getting ready
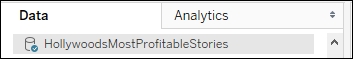
To follow this recipe, open B05527_01 – STARTER.twbx. Use the worksheet called Text Table, and connect to the HollywoodMostProfitableStories data source.
How to do it...
The following are the steps to create the crosstab:
Change the default number format of Audience score %. You can do this by right-clicking the field Audience score % in the Measures section of the side bar, selecting Default properties and then Number Format…. In the window that shows up, set the following:
Number (Custom)
Decimal places:
0Suffix %
From Dimensions, drag Film to Rows.
From Dimensions, drag Year to Rows.
From Dimensions, drag Film to Filters. This will open a window with several options for filtering the Film field.
Select the Top tab. Choose By field: and specify Top 20 by Average Rotten Tomatoes %, as shown here:

From Measures, drag Worldwide Gross Amount to Text in the Marks card.
Right-click on the Worldwide Gross Amount pill in the Marks card, and choose Format.
Format the Pane tab to use:
Currency (Custom)
Decimal places:
0Prefix:
$

Double-click on Audience score % in the Measures pane. This adds this measure to the text table. This also introduces a new Measure Values shelf in your canvas.
From Measures, double-click on Rotten Tomatoes % to add this to the text table.
Change the Rotten Tomatoes % aggregation to Average. You can do this by right-clicking on this pill in the Measure Values shelf, going to Measure (Sum), and changing this to Average.
From Measures, double-click on Audience Score % to add this to the text table.
Change the aggregation of Audience Score % to Average.
From Measures, double-click on Profitability to add this to the text table.
Rearrange the pills in the Measure Values shelf by dragging them manually to have the following order:

Right-click the Film pill in Rows, and click on Sort….
In the Sort window, select:
Sort order Descending
Sort by field Worldwide Gross Amount using Aggregation of Sum
How it works...
A text table is simply a series of text values and numbers in a grid. This is a pretty common request for organizations that are very numbers-oriented, and have just started transitioning to a more visual culture.
To create a text table in Tableau, usually you identify the dimensions you want to place in your Rows and/or Columns. There are a couple ways to create the text table:
Drag the measures onto the middle canvas until you see the Show Me icon, and then let go of the mouse
Drag the first measure onto Text in the Marks card, and double-click on the rest of the measures you want to add
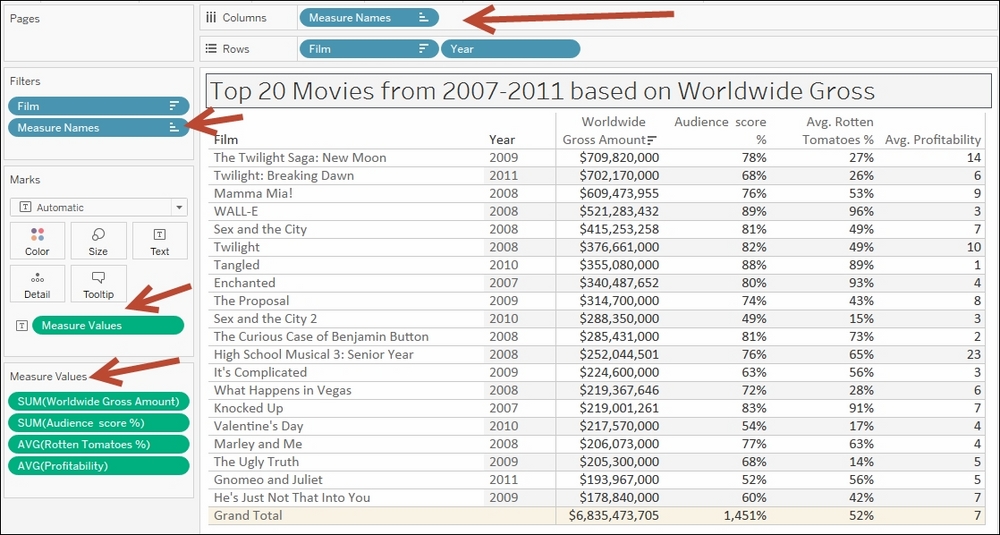
Both of these actions introduce the Measure Names and Measure Values pills in your visualization.
Note
Measure Names and Measure Values are discussed in more detail in Appendix C, Working with Tableau 10.
Measure Names, which is discrete, gets placed in your Rows or Columns as a header, and Measure Values gets placed onto the Text property in your Marks card:
There's more...
Tableau places limitations on creating text tables. By default, for example, only six columns will display properly. If you have more than six columns, the leftmost columns get concatenated.
To adjust this, you need to go to the Analysis menu, then Table Layout, then Advanced. There you can adjust the number of rows and column labels.
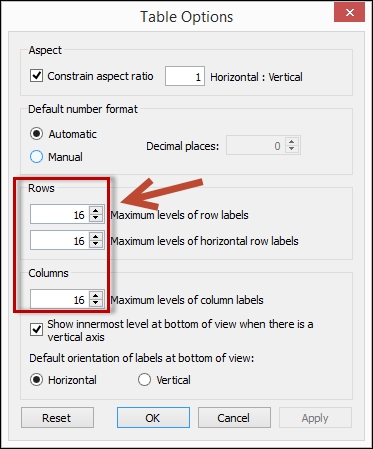
Tableau still, however, restricts this number. The maximum you can use is sixteen (16). Ultimately, if you need more columns and want to display all the numbers in the table, but not necessarily support visual analysis, then perhaps Tableau isn't the tool that is meant to do that job. Tableau is a great tool for visual analysis and exploration, so it is best to use it as such.
See also
Please refer to the Creating a highlight table recipe in this chapter


