Anatomy of a chart
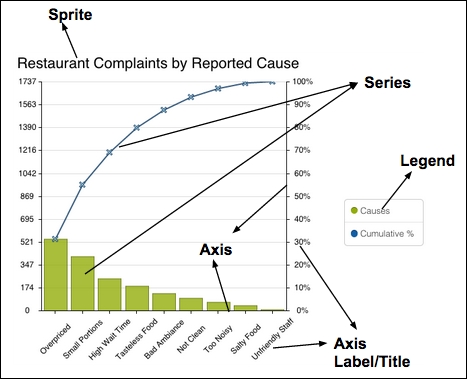
A chart has different areas. Each area has its own name. These names will act as the terminology that Sencha Charts will use and they will be used throughout this book. The following diagram depicts a cartesian chart created using Sencha Charts with its different areas:

Let's take a look at a few of the terminologies highlighted in the preceding figure:
Sprite: This is an object that is rendered on a drawing surface—
Ext.draw.Surface—which we discussed in the previous chapter. Sencha Charts offers many different types of sprite, such as arc, circle, rectangle, path, and text, all of which are used internally to create different types of chart. They can also be added directly to a chart. In the preceding diagram, a text sprite is used to show the chart title.Series: This class is very specific to the type of chart that we want to draw. For example, Sencha Charts uses area series to draw area charts, whereas bar series draw bar charts. Based on the samples/data, the series...


