Missing data refers to the absence of a value for observations and is a common occurrence in most datasets. Scikit-learn, the open source Python library for machine learning, does not support missing values as input for machine learning models, so we need to convert these values into numbers. To select the missing data imputation technique, it is important to know about the amount of missing information in our variables. In this recipe, we will learn how to identify and quantify missing data using pandas and how to make plots with the percentages of missing data per variable.
Quantifying missing data
Getting ready
In this recipe, we will use the KDD-CUP-98 dataset from the UCI Machine Learning Repository. To download this dataset, follow the instructions in the Technical requirements section of this chapter.
How to do it...
First, let's import the necessary Python libraries:
- Import the required Python libraries:
import pandas as pd
import matplotlib.pyplot as plt
- Let's load a few variables from the dataset into a pandas dataframe and inspect the first five rows:
cols = ['AGE', 'NUMCHLD', 'INCOME', 'WEALTH1', 'MBCRAFT', 'MBGARDEN', 'MBBOOKS', 'MBCOLECT', 'MAGFAML','MAGFEM', 'MAGMALE']
data = pd.read_csv('cup98LRN.txt', usecols=cols)
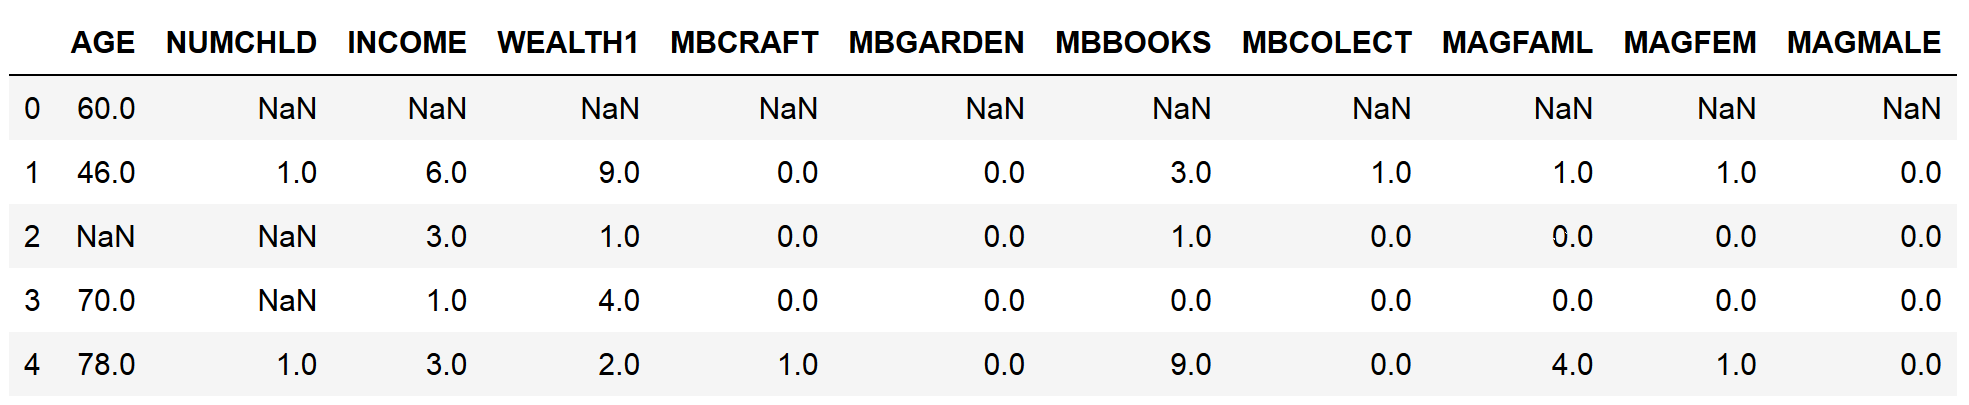
data.head()
After loading the dataset, this is how the output of head() looks like when we run it from a Jupyter Notebook:
- Let's calculate the number of missing values in each variable:
data.isnull().sum()
The number of missing values per variable can be seen in the following output:
AGE         23665
NUMCHLD     83026
INCOME      21286
WEALTH1     44732
MBCRAFT     52854
MBGARDEN    52854
MBBOOKS     52854
MBCOLECT    52914
MAGFAML     52854
MAGFEM      52854
MAGMALE     52854
dtype: int64
- Let's quantify the percentage of missing values in each variable:
data.isnull().mean()
The percentages of missing values per variable can be seen in the following output, expressed as decimals:
AGE         0.248030
NUMCHLD     0.870184
INCOME      0.223096
WEALTH1     0.468830
MBCRAFT     0.553955
MBGARDEN    0.553955
MBBOOKS     0.553955
MBCOLECT    0.554584
MAGFAML     0.553955
MAGFEM      0.553955
MAGMALE 0.553955
dtype: float64
- Finally, let's make a bar plot with the percentage of missing values per variable:
data.isnull().mean().plot.bar(figsize=(12,6))
plt.ylabel('Percentage of missing values')
plt.xlabel('Variables')
plt.title('Quantifying missing data')
The bar plot that's returned by the preceding code block displays the percentage of missing data per variable:
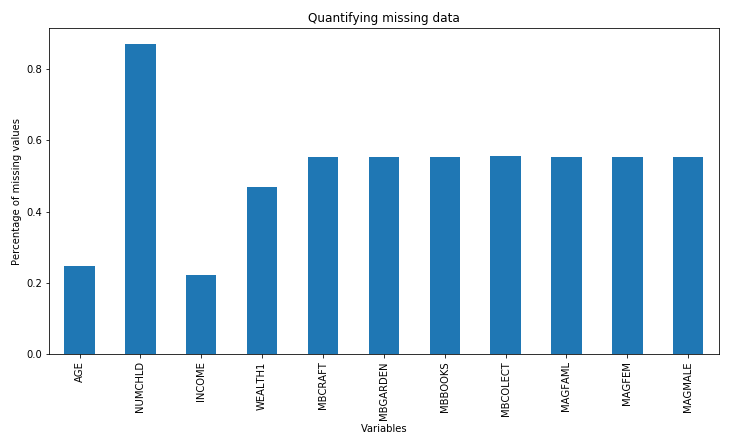
We can change the figure size using the figsize argument within pandas plot.bar() and we can add x and y labels and a title with the plt.xlabel(), plt.ylabel(), and plt.title() methods from Matplotlib to enhance the aesthetics of the plot.
How it works...
In this recipe, we quantified and displayed the amount and percentage of missing data of a publicly available dataset.
To load data from the txt file into a dataframe, we used the pandas read_csv() method. To load only certain columns from the original data, we created a list with the column names and passed this list to the usecols argument of read_csv(). Then, we used the head() method to display the top five rows of the dataframe, along with the variable names and some of their values.
To identify missing observations, we used pandas isnull(). This created a boolean vector per variable, with each vector indicating whether the value was missing (True) or not (False) for each row of the dataset. Then, we used the pandas sum() and mean() methods to operate over these boolean vectors and calculate the total number or the percentage of missing values, respectively. The sum() method sums the True values of the boolean vectors to find the total number of missing values, whereas the mean() method takes the average of these values and returns the percentage of missing data, expressed as decimals.
To display the percentages of the missing values in a bar plot, we used pandas isnull() and mean(), followed by plot.bar(), and modified the plot by adding axis legends and a title with the xlabel(), ylabel(), and title() Matplotlib methods.