Search icon CANCEL
Subscription
0
Cart icon
Cart
Close icon
You have no products in your basket yet
Save more on your purchases!
Savings automatically calculated. No voucher code required
Arrow left icon
All Products
Best Sellers
New Releases
Books
Videos
Audiobooks
Learning Hub
Newsletters
Free Learning
Arrow right icon
Arrow up icon
GO TO TOP
Python Feature Engineering Cookbook

You're reading from  Python Feature Engineering Cookbook

Product type Book
Published in Jan 2020
Publisher Packt
ISBN-13 9781789806311
Pages 372 pages
Edition 1st Edition
Languages
Author (1):
Soledad Galli Soledad Galli
Profile icon Soledad Galli
Toc

Table of Contents (13) Chapters close

Preface 1. Foreseeing Variable Problems When Building ML Models 2. Imputing Missing Data 3. Encoding Categorical Variables 4. Transforming Numerical Variables 5. Performing Variable Discretization 6. Working with Outliers 7. Deriving Features from Dates and Time Variables 8. Performing Feature Scaling 9. Applying Mathematical Computations to Features 10. Creating Features with Transactional and Time Series Data 11. Extracting Features from Text Variables 12. Other Books You May Enjoy

Identifying numerical and categorical variables

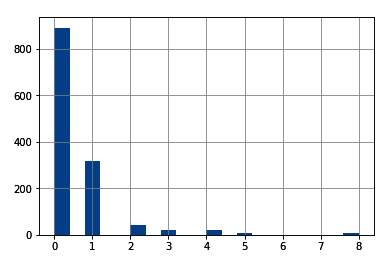
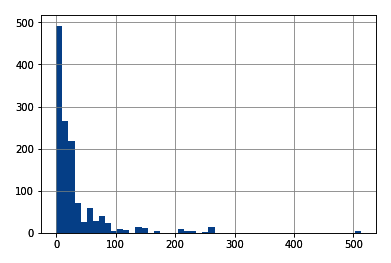
Numerical variables can be discrete or continuous. Discrete variables are those where the pool of possible values is finite and are generally whole numbers, such as 1, 2, and 3. Examples of discrete variables include the number of children, number of pets, or the number of bank accounts. Continuous variables are those whose values may take any number within a range. Examples of continuous variables include the price of a product, income, house price, or interest rate. Categorical variables are values that are selected from a group of categories, also called labels. Examples of categorical variables include gender, which takes values of male and female, or country of birth, which takes values of Argentina, Germany, and so on.

In this recipe, we will learn how to identify continuous, discrete, and categorical variables by inspecting their values and the data type that they are stored and loaded with in pandas.

Getting ready

Discrete variables are usually of the int type, continuous variables are usually of the float type, and categorical variables are usually of the object type when they're stored in pandas. However, discrete variables can also be cast as floats, while numerical variables can be cast as objects. Therefore, to correctly identify variable types, we need to look at the data type and inspect their values as well. Make sure you have the correct library versions installed and that you've downloaded a copy of the Titanic dataset, as described in the Technical requirements section.

How to do it...

First, let's import the necessary Python libraries:

  1. Load the libraries that are required for this recipe:
import pandas as pd
import matplotlib.pyplot as plt
  1. Load the Titanic dataset and inspect the variable types:
data = pd.read_csv('titanic.csv')
data.dtypes

The variable types are as follows:

pclass         int64
survived       int64
name          object
sex           object
age          float64
sibsp          int64
parch          int64
ticket        object
fare         float64
cabin         object
embarked      object
boat          object
body         float64
home.dest     object
dtype: object
In many datasets, integer variables are cast as float. So, after inspecting the data type of the variable, even if you get float as output, go ahead and check the unique values to make sure that those variables are discrete and not continuous.
  1. Inspect the distinct values of the sibsp discrete variable:
data['sibsp'].unique()

The possible values that sibsp can take can be seen in the following code:

array([0, 1, 2, 3, 4, 5, 8], dtype=int64)
  1. Now, let's inspect the first 20 distinct values of the continuous variable fare:
data['fare'].unique()[0:20]

The following code block identifies the unique values of fare and displays the first 20:

array([211.3375, 151.55  ,  26.55  ,  77.9583,   0.    ,  51.4792,
        49.5042, 227.525 ,  69.3   ,  78.85  ,  30.    ,  25.925 ,
       247.5208,  76.2917,  75.2417,  52.5542, 221.7792,  26.    ,
        91.0792, 135.6333])

Go ahead and inspect the values of the embarked and cabin variables by using the command we used in step 3 and step 4.

The embarked variable contains strings as values, which means it's categorical, whereas cabin contains a mix of letters and numbers, which means it can be classified as a mixed type of variable.

How it works...

In this recipe, we identified the variable data types of a publicly available dataset by inspecting the data type in which the variables are cast and the distinct values they take. First, we used pandas read_csv() to load the data from a CSV file into a dataframe. Next, we used pandas dtypes to display the data types in which the variables are cast, which can be float for continuous variables, int for integers, and object for strings. We observed that the continuous variable fare was cast as float, the discrete variable sibsp was cast as int, and the categorical variable embarked was cast as an objectFinally, we identified the distinct values of a variable with the unique() method from pandas. We used unique() together with a range, [0:20], to output the first 20 unique values for fare, since this variable shows a lot of distinct values.

There's more...

To understand whether a variable is continuous or discrete, we can also make a histogram:

  1. Let's make a histogram for the sibsp variable by dividing the variable value range into 20 intervals:
data['sibsp'].hist(bins=20)

The output of the preceding code is as follows:

Note how the histogram of a discrete variable has a broken, discrete shape.

  1. Now, let's make a histogram of the fare variable by sorting the values into 50 contiguous intervals:
data['fare'].hist(bins=50)

The output of the preceding code is as follows:

The histogram of continuous variables shows values throughout the variable value range.

See also

For more details on pandas and variable types, check out https://pandas.pydata.org/pandas-docs/stable/getting_started/basics.html#basics-dtypes.

For details on other variables in the Titanic dataset, check the accompanying Jupyter Notebook in this book's GitHub repository (https://github.com/PacktPublishing/Python-Feature-Engineering-Cookbook).

lock icon The rest of the chapter is locked
Register for a free Packt account to unlock a world of extra content!
A free Packt account unlocks extra newsletters, articles, discounted offers, and much more. Start advancing your knowledge today.
Unlock this book and the full library FREE for 7 days
Get unlimited access to 7000+ expert-authored eBooks and videos courses covering every tech area you can think of
Renews at $15.99/month. Cancel anytime