
The number of unique categories in a variable is called cardinality. For example, the cardinality of the Gender variable, which takes values of female and male, is 2, whereas the cardinality of the Civil status variable, which takes values of married, divorced, singled, and widowed, is 4. In this recipe, we will learn how to quantify and create plots of the cardinality of categorical variables using pandas and Matplotlib.
Determining cardinality in categorical variables
Getting ready
In this recipe, we will use the KDD-CUP-98 dataset from the UCI Machine Learning Repository. To download this dataset, follow the instructions in the Technical requirements section of this chapter.
How to do it...
Let's begin by importing the necessary Python libraries:
- Import the required Python libraries:
import pandas as pd
import numpy as np
import matplotlib.pyplot as plt
- Let's load a few categorical variables from the dataset:
cols = ['GENDER', 'RFA_2', 'MDMAUD_A', 'RFA_2', 'DOMAIN', 'RFA_15']
data = pd.read_csv('cup98LRN.txt', usecols=cols)
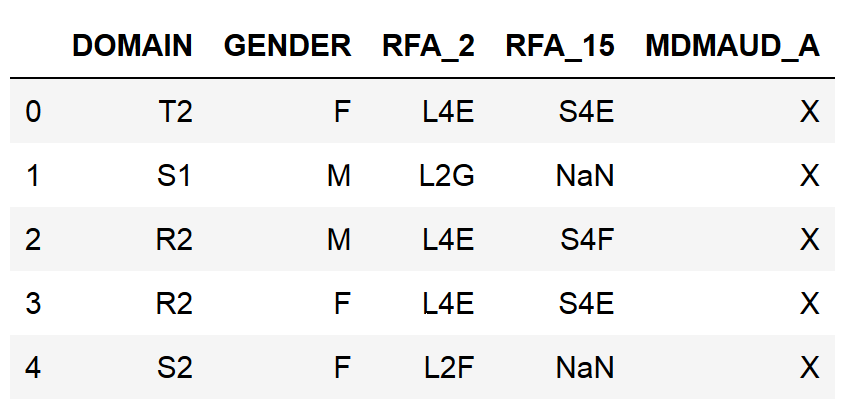
- Let's replace the empty strings with NaN values and inspect the first five rows of the data:
data = data.replace(' ', np.nan)
data.head()
After loading the data, this is what the output of head() looks like when we run it from a Jupyter Notebook:
- Now, let's determine the number of unique categories in each variable:
data.nunique()
The output of the preceding code shows the number of distinct categories per variable, that is, the cardinality:
DOMAIN      16
GENDER       6
RFA_2       14
RFA_15      33
MDMAUD_A     5
dtype: int64
The nunique() method ignores missing values by default. If we want to consider missing values as an additional category, we should set the dropna argument to False: data.nunique(dropna=False).
- Now, let's print out the unique categories of the GENDER variable:
data['GENDER'].unique()
We can see the distinct values of GENDER in the following output:
array(['F', 'M', nan, 'C', 'U', 'J', 'A'], dtype=object)
pandas nunique() can be used in the entire dataframe. pandas unique(), on the other hand, works only on a pandas Series. Thus, we need to specify the column name that we want to return the unique values for.
- Let's make a plot with the cardinality of each variable:
data.nunique().plot.bar(figsize=(12,6))
plt.ylabel('Number of unique categories')
plt.xlabel('Variables')
plt.title('Cardinality')
The following is the output of the preceding code block:
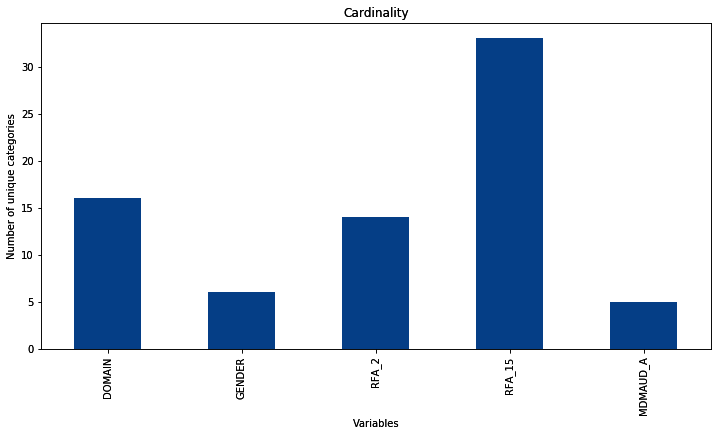
We can change the figure size with the figsize argument and also add x and y labels and a title with plt.xlabel(), plt.ylabel(), and plt.title() to enhance the aesthetics of the plot.
How it works...
In this recipe, we quantified and plotted the cardinality of the categorical variables of a publicly available dataset.
To load the categorical columns from the dataset, we captured the variable names in a list. Next, we used pandas read_csv() to load the data from a txt file onto a dataframe and passed the list with variable names to the usecols argument.
Many variables from the KDD-CUP-98 dataset contained empty strings which are, in essence, missing values. Thus, we replaced the empty strings with the NumPy representation of missing values, np.nan, by utilizing the pandas replace() method. With the head() method, we displayed the top five rows of the dataframe.
To quantify cardinality, we used the nunique() method from pandas, which finds and then counts the number of distinct values per variable. Next, we used the unique() method to output the distinct categories in the GENDER variable.
To plot the variable cardinality, we used pandas nunique(), followed by pandas plot.bar(), to make a bar plot with the variable cardinality, and added axis labels and a figure title by utilizing the Matplotlib xlabel(), ylabel(), and title() methods.
There's more...
The nunique() method determines the number of unique values for categorical and numerical variables. In this recipe, we only used nunique() on categorical variables to explore the concept of cardinality. However, we could also use nunique() to evaluate numerical variables.
We can also evaluate the cardinality of a subset of the variables in a dataset by slicing the dataframe:
data[['RFA_2', 'MDMAUD_A', 'RFA_2']].nunique()
The following is the output of the preceding code:
RFA_2       14
MDMAUD_A     5
RFA_2       14
dtype: int64
In the preceding output, we can see the number of distinct values each of these variables can take.