Using selective tracing
When trying to troubleshoot a particularly difficult problem, there is a often need to increase logging. However, as a side effect of running logs with verbose logging, it can be very time consuming to filter through all of the messages in the log. Many of the messages may be unrelated to the process, which can further increase the amount of time it takes to find the source of the issue. Thankfully, there is a capability within WebLogic Server that allows us to get a better idea of what's happening when there is an issue in SOA or OSB without needing to completely overload the log files with unnecessary information.
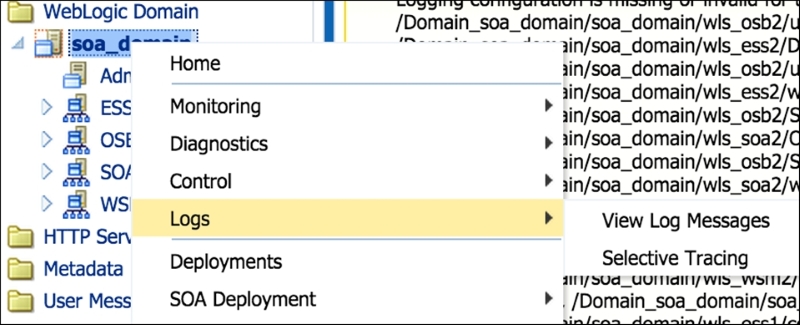
To access Selective Tracing, expand the WebLogic Domain folder when you log in to Fusion Middleware Control and right-click on the target domain. A menu will pop up, as shown in the following figure, where you need to navigate to Logs | Selective Tracing:

Figure 9.10: The domain menu showing the path to Selective Tracing
Once the selective tracing page has...


