Activating Odoo developer tools
When using Odoo as a developer, you need to know how to activate developer mode in the web interface so that you can access the technical settings menu and developer information. Enabling debug mode will expose several advanced configuration options and fields. These options and fields are hidden in Odoo for better usability because they are not used daily.
How to do it...
To activate developer mode in the web interface, perform the following steps:
- Connect to your instance and authenticate as
admin. - Go to the Settings menu.
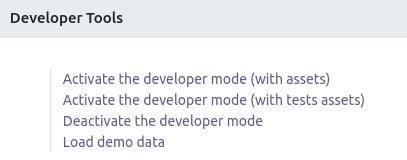
- Scroll to the bottom and locate the Developer Tools section:

Figure 1.12 – Links to activate different developer modes
- Click Activate the developer mode.
- Wait for the UI to reload.
Alternative way
It is also possible to activate developer mode by editing the URL. Before the # sign, insert ?debug=1. For example, if your current URL is http://localhost:8069/web#menu_id=102&action=94 and you want to enable developer mode, then you need to change that URL to http://localhost:8069/web?debug=1#menu_id=102&action=94. Furthermore, if you want to use debug mode with assets, then change the URL to http://localhost:8069/web?debug=assets#menu_id=102&action=94.
To exit developer mode, you can perform any one of the following operations:
- Edit the URL and write
?debug=0in the query string - Use Deactivate the developer mode from the same place in the Settings menu
- Click on the bug icon in the top menu and click on the Leave Developer Tools option
Lots of developers are using browser extensions to toggle debug mode. By doing this, you can toggle debug mode quickly without accessing the Settings menu. These extensions are available for Firefox and Chrome. The following screenshot shows one such plugin you can use and find in the Chrome store:

Figure 1.13 – Browser extension for debug mode
Note
The behavior of the debug mode has changed since Odoo v13. Since v13, the status of debug mode is stored in the session, implying that even if you have removed ?debug from the URL, debug mode will still be active.
How it works...
In developer mode, two things happen:
- You get tooltips when hovering over a field in a form view or over a column in a list view. These provide technical information about the field (internal name, type, and so on).
- A drop-down menu with a bug icon is displayed next to the user’s menu in the top-right corner, giving you access to technical information about the model being displayed, the various related view definitions, the workflow, custom filter management, and so on.
There is a variant of developer mode called Developer mode (with assets). This mode behaves like the normal developer mode, but the JavaScript and CSS code that’s sent to the browser is not minified, which means that the web development tools of your browser can easily be used to debug the JavaScript code (more on this in Chapter 15, Web Client Development).
Caution!
Test your add-ons both with and without developer mode since the unminified versions of the JavaScript libraries can hide bugs that only bite you in the minified version.


