Search icon CANCEL
Subscription
0
Cart icon
Your Cart (0 item)
Close icon
You have no products in your basket yet
Arrow left icon
Explore Products
Best Sellers
New Releases
Books
Events
Videos
Audiobooks
Packt Hub
Free Learning
Arrow right icon
timer SALE ENDS IN
0 Days
:
00 Hours
:
00 Minutes
:
00 Seconds
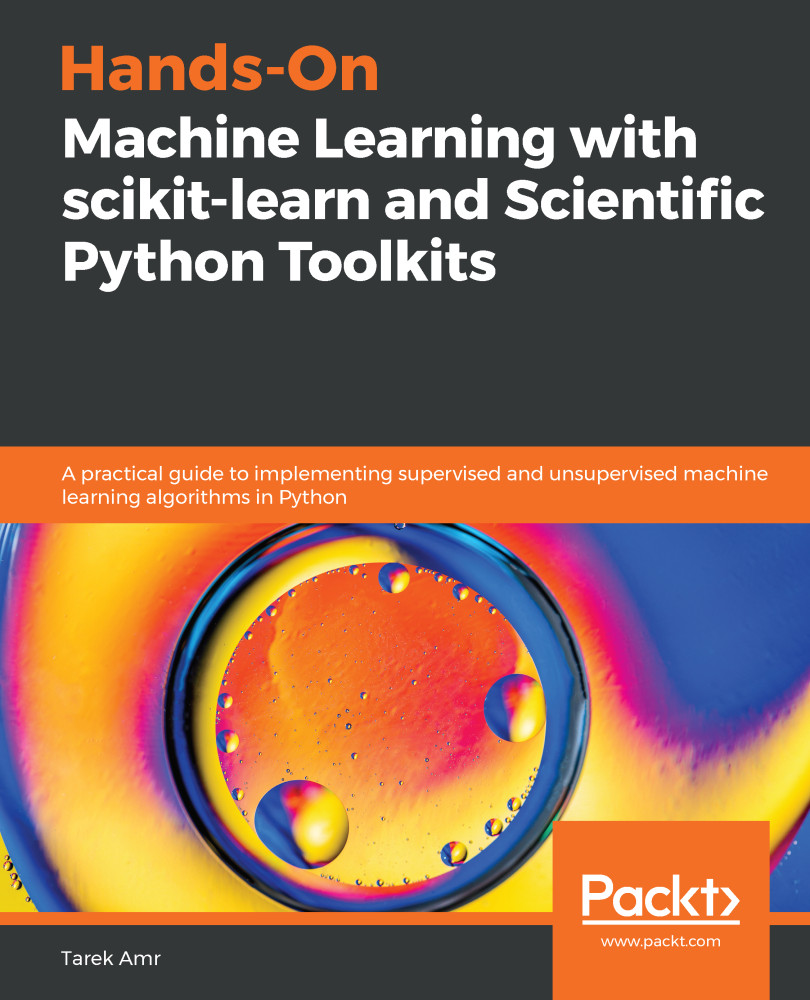
Hands-On Machine Learning with scikit-learn and Scientific Python Toolkits

Hands-On Machine Learning with scikit-learn and Scientific Python Toolkits: A practical guide to implementing supervised and unsupervised machine learning algorithms in Python

eBook
$27.89 $30.99
Paperback
$45.99
eBook + Subscription
$29.99 Monthly

What do you get with eBook?

Product feature icon Instant access to your Digital eBook purchase
Product feature icon Download this book in EPUB and PDF formats
Product feature icon Access this title in our online reader with advanced features
Product feature icon DRM FREE - Read whenever, wherever and however you want
Product feature icon AI Assistant (beta) to help accelerate your learning
Modal Close icon
Payment Processing...
tick Completed

Billing Address

Table of content icon View table of contents Preview book icon Preview Book

Hands-On Machine Learning with scikit-learn and Scientific Python Toolkits

Introduction to Machine Learning

Machine learning is everywhere. When you book a flight ticket, an algorithm decides the price you are going to pay for it. When you apply for a loan, machine learning may decide whether you are going to get it or not. When you scroll through your Facebook timeline, it picks which advertisements to show to you. Machine learning also plays a big role in your Google search results. It organizes your email's inbox and filters out spam, it goes through your resumé before recruiters when you apply for a job, and, more recently, it has also started to play the role of your personal assistant in the form of Siri and other virtual assistants.

In this book, we will learn about the theory and practice of machine learning. We will understand when and how to apply it. To get started, we will look at a high-level introduction to how machine learning works. You will then be able to differentiate between the different machine learning paradigms and know when to use each of them. Then, you'll be taken through the model development life cycle and the different steps practitioners take to solve problems. Finally, we will introduce you to scikit-learn, and learn why it is the de facto tool for many practitioners.

Here is a list of the topics that will be covered in this first chapter:

  • Understanding machine learning
  • The model development life cycle
  • Introduction to scikit-learn
  • Installing the packages you need

Understanding machine learning

You may be wondering how machines actually learn. To get the answer to this query, let's take the following example of a fictional company. Space Shuttle Corporation has a few space vehicles to rent. They get applications every day from clients who want to travel to Mars. They are not sure whether those clients will ever return the vehicles—maybe they'll decide to continue living on Mars and never come back again. Even worse, some of the clients may be lousy pilots and crash their vehicles on the way. So, the company decides to hire shuttle rent-approval officers whose job is to go through the applications and decide who is worthy of a shuttle ride. Their business, however, grows so big that they need to formulate the shuttle-approval process.

A traditional shuttle company would start by having business rules and hiring junior employees to execute those rules. For example, if you are an alien, then sorry, you cannot rent a shuttle from us. If you are a human and you have kids that are in school on Earth, then you are more than welcome to rent one of our shuttles. As you can see, those rules are too broad. What about aliens who love living on Earth and just want to go to Mars for a quick holiday? To come up with a better business policy, the company starts hiring analysts. Their job is to go through historical data and try to come up with detailed rules or business logic. These analysts can come up with very detailed rules. If you are an alien, one of your parents is from Neptune, your age is between 0.1 and 0.2 Neptunian years, and you have 3 to 4 kids and one of them is 80% or more human, then you are allowed to rent a shuttle. To be able to come up with suitable rules, the analysts also need a way to measure how good this business logic is. For example, what percentage of the shuttles return if certain rules are applied? They use historic data to evaluate these measures, and only then can wesay that these rules are actually learned from data.

Machine learning works in almost the same way. You want to use historic data to come up with some business logic (an algorithm) in order to optimize some measure of how good the logic is (an objective or loss function). Throughout this book, we will learn about numerous machine learning algorithms; they differ from each other in how they represent business logic, what objective functions they use, and what optimization techniques they utilize to reach a model that maximizes (or sometimes minimizes) the objective function. Like the analysts in the previous example, you should pick an objective function that is as close as possible to your business objective. Any time you hear people saying data scientists should have a good understanding of their business, a significant part of that is their choice of a good objective function and ways to evaluate the models they build. In my example, I quickly picked the percentage of shuttles returned as my objective.

But if you think about it, is this really an accurate one-to-one mapping of the shuttle company's revenue? Is the revenue made by allowing a trip equal to the cost of losing a shuttle? Furthermore, rejecting a trip may also cost your company angry calls to the customer care center and negative word-of-mouth advertising. You have to understand all of this well enough before picking your objective function.

Finally, a key benefit to using machine learning is that it can iterate over a vast amount of business logic cases until it reaches the optimum objective function, unlike the case of the analysts in our space shuttle company who can only go so far with their rules. The machine learning approach is also automated in the sense that it keeps updating the business logic whenever new data arrives. These two aspects make it scalable, more accurate, and adaptable to change.

Types of machine learning algorithms

"Society is changing, one learning algorithm at a time."
– Pedro Domingos

In this book, we are going to cover the two main paradigms of machine learning—supervised learning and unsupervised learning. Each of these two paradigms has its own sub-branches that will be discussed in the next section. Although it is not covered in this book, reinforcement learning will also be introduced in the next section:

Let's use our fictional Space Shuttle Corporation company once more to explain the differences between the different machine learning paradigms.

Supervised learning

Remember those old good days at school when you were given examples to practice on, along with the correct answers to them at the end to validate whether you are doing a good job? Then, at exam time, you were left on your own. That's basically what supervised learning is. Say our fictional space vehicle company wants to predict whether travelers will return their space vehicles. Luckily, the company has worked with many travelers in the past, and they already know which of them returned their vehicles and who did not. Think of this data as a spreadsheet, where each column has some information about the travelers—their financial statements, the number of kids they have, whether they are humans or aliens, and maybe their age (in Neptunian years, of course). Machine learners call these columns features. There is one extra column for previous travelers that states whether they returned or not; we call this column the label or target column. In the learning phase, we build a model using the features and targets. The aim of the algorithm while learning is to minimize the differences between its predictions and the actual targets. The difference is what we call the error. Once a model is constructed so that its error is minimal, we then use it to make predictions for newer data points. For new travelers, we only know their features, but we use the model we've just built to predict their corresponding targets. In a nutshell, the presence of the target in our historic data is what makes this process supervised.

Classification versus regression

Supervised learning is furthersubdivided into classification and regression. For cases where we only have a few predefined labels to predict, we use a classifier—for example, returnversusno return orhuman versusMartian versusVenusian. If what we want to predict is a wide-range number—say, how many years a traveler will take to come back—then it is a regression problem since these values can be anything from 1 or 2 years to 3 years, 5 months, and 7 days.

Supervised learning evaluation

Due to their differences, the metrics we use to evaluate these classifiers are usually different from ones we use with regression:

  • Classifier evaluation metrics: Suppose we are using a classifier to determine whether a traveler is going to return. Then, of those travelers that the classifier predicted to return, we want to measure what percentage of them actually did return. We call this measure precision. Also, of all travelers who did return, we want to measure what percentage of them the classifier correctly predicted to return. We call this recall. Precision and recall can be calculated for each class—that is, we can also calculate precision and recall for the travelers who did not return.

Accuracy is another commonly used, and sometimes abused, measure. For each case in our historic data, we know whether a traveler actually returned (actuals) and we can also generate predictions of whether they will return. The accuracy calculates what percentage of cases of the predictions and actuals match. As you can see, it is labeled agnostic, so it can sometimesbe misleading when the classes are highly imbalanced. In our example business, say 99% of our travelers actually return. We can build a dummy classifier that predicts whether every single traveler returns; it will be accurate 99% of the time. This 99% accuracy value doesn't tell us much, especially if you know that in these cases, the recall value for non-returning travelers is 0%. As we are going to see later on in this book, each measure has its pros and cons, and a measure is only as good as how close it is to our business objectives. We are also going to learn about other metrics, such as F1 score, AUC, and log loss.

  • Regressor evaluation metrics: If we are using a regressor to tell how long a traveler will stay, then we need to determine how far the numbers that the regression evaluation is predicting are from reality. Let's say for three users, the regressor expected them to stay for 6, 9, and 20 years, respectively, while they actually stayed for 5, 10, and 26 years, respectively. One solution is to calculate the average of the differences between the prediction and the reality—the average of 6–5, 9–10, and 20–25, so the average of 1, -1, and -6 is -2. One problem with these calculations is that 1 and -1 cancel each other out. If you think about it, both 1 and -1 are mistakes that the model made, and the sign might not matter much here.

So, we will need to use Mean Absolute Error(MAE) instead. This calculates the average of the absolute values of the differences—so, the average of 1, 1, and 6 is 2.67. This makes more sense now, but what if we can tolerate a 1-year difference more than a 6-year difference? We can then useMean Squared Error(MSE) to calculate the average of the differences squared—so, the average of 1, 1, and 36 is 12.67. Clearly, each measure has its pros and cons here as well. Additionally, we can also use different variations of these metrics, such as median absolute error or max error. Furthermore, sometimes your business objective can dictate other measures. Say we want to penalize the model if it predicts that a traveler will arrive 1 year later twice as often as when it predicts them to arrive 1 year earlier—what metric can you come up with then?

In practice, the lines between classification and regression problems can get blurred sometimes. For the case of how many years a traveler will take to return, you can still decide to bucket the range into 1–5 years, 5–10 years, and 10+ years. Then, you end up with a classification problem to solve instead. Conversely, classifiers return probabilities along with their predicted targets. For the case of whether a user will return, a predicted value of 60% and 95% means the same thing from a binary classifier's point of view, but the classifier is more confident that the traveler will return in the second case compared to the first case. Although this is still a classification problem, we can use the Brier score to evaluate our classifier here, which is actually MSE in disguise. More on the Brier score will be covered in Chapter 9, The Y is as important as the X. Most of the time, it is clear whether you are facing a classification or regression problem, but always keep your eyes open to the possibility of reformulating your problem if needed.

Unsupervised learning

Life doesn't always provide us with correct answers as was the case when we were in school. We have been told that space travelers like it when they are traveling with like-minded passengers. We already know a lot about our travelers, but of course, no traveler will say by the way, I am a type A, B, or C traveler. So, to group our clients, we use a form of unsupervised learning called clustering. Clustering algorithms try to come up with groups and put our travelers into them without us telling them what groups may exist. Unsupervised learning lacks targets, but this doesn't mean that we cannot evaluate our clustering algorithms. We want the members of a cluster to be similar to each other, but we also want them to be dissimilar from the members of adjacent clusters. The silhouette coefficient basically measures that. We will come across other measures for clustering, such as the Davies-Bouldinindex and the Calinski-Harabaszindex, later in this book

Reinforcement learning

Reinforcement learning is beyond the scope of this book and is not implemented in scikit-learn. Nevertheless, I will briefly talk about it here. In the supervised learning examples we have looked at, we treated each traveler separately. If we want to know which travelers are going to return their space vehicles the earliest, our aim then is to pick the best travelers for our business. But if you think about it, the behavior of one traveler affects the experience of the others as well. We only allow space vehicles to stay up to 20 years in space. However, we haven't explored the effect of allowing some travelers to stay longer or the effect of having a stricter rent period for other travelers. Reinforcement learning is the answer to that, where the key to it is exploration and exploitation.

Rather than dealing with each action separately, we may want to explore sub-optimal actions in order to reach an overall optimumset of actions. Reinforcement learning is used in robotics, where a robot has a goal and it can only reach it through a sequence of steps—2 steps to the right, 5 steps forward, and so on. We can't tell whether a right versus left step is better on its own; the whole sequence must be found to reach the best outcome. Reinforcement learningis also used in gaming, as well as in recommendation engines. If Netflix only recommended to a user what matches their taste best, a user may end up with nothing but Star Wars movies on their home screen. Reinforcement learning is thenneeded to explore less-optimum matches to enrich the user's overall experience.

The model development life cycle

When asked to solve a problem using machine learning, data scientists achieve this by following a sequence of steps. In this section, we are going to discuss those iterative steps.

Understanding a problem

"All models are wrong, but some are useful."
– George Box

The first thing to do when developing a model is to understand the problem you are trying to solve thoroughly. This not only involves understanding what problem you are solving, but also why you are solving it, what impact are you expecting to have, and what the currently available solution isthat you are comparing your new solution to. My understanding of what Box said when he stated that all models are wrong is that a model is just an approximation of reality by modeling one or more angles of it. By understanding the problem you are trying to solve, you can decide which angles of reality you need to model, and which ones you can tolerate ignoring.

You also need to understand the problem well to decide how to split your data for training and evaluation (more on that in the next section). You can then decide what kind of model to use. Is the problem suitable for supervised or unsupervised learning? Are we better off using classification or regression algorithms for this problem? What kind of classification algorithm will serve us best? Is a linear model good enough to approximate our reality? Do we need the most accurate model or one that we can easily explain to its users and to the business stakeholders?

Minimal exploratory data analysis can be done here, where you can check whether you have labels and check the cardinality of the labels, if present, to decide whether you are dealing with a classification or a regression problem. I would still save any further data analysis until after the dataset is split into training and test sets. It is important to limit advanced data analysis to the training set only to ensure your model's generalizability.

Finally, we need to understand what we are comparing our model to. What is the current baseline that we need to improve on? If there are already business rules in place, then our model has to be better at solving the problem at hand than these rules. To be able to decide how much better it is at solving the problem, we need to use evaluation metrics—metrics that are suitable for our model and also as close as possible to our business requirements. If our aim is to increase revenue, then our metric should be good at estimating the increase in revenue when our model is used, compared to the current status quo. If our aim is to increase repeat purchases regardless of the revenue, then other metrics may be more suitable.

Splitting our data

As we have seen in supervised learning, we train our model on a set of data where the correct answers (labels) are given. Learning, however, is only half of the problem. We also want to be able to tell whether the model we built is going to do a good job when used on future data. We cannot foresee the future, but we can use the data we already have to evaluate our model.

We do this by splitting our data into parts. We use one part of the data to train the model (the training set) and then use a separate part to evaluate the model (the test set). Since we want our test set to be as close as possible to the future data, there are two key points discussed in the following subsections to keep in mind when splitting our data:

  • Finding the best manner to split the data
  • Making sure the training and test datasets are separate

Finding the best manner to split the data

Say your users' data is sorted according to their country in alphabetical order. If you just take the first N records for training and the rest for testing, you will end up training the model on users from certain countries and will never let it learn anything about users from, say, Zambia and Zimbabwe. So, one common solution is to randomize your data before splitting it. Random split is not always the best option, however. Say we want to build a model to predict the stock prices or climate change phenomena a few years ahead. To be confident that our system will capture temporal trends such as global warming, we need to split our data based on time. We can train on earlier data and see whether the model can do a good job in predicting more recent data.

Sometimes, we just predict rare incidents. It can be that the number of fraud cases that occur in your payment system is 0.1%. If you randomly split your data, you may be unlucky and have the vast majority of the fraud cases in the training data and very few cases in the test data, or vice versa. So, it is advised that you use stratification when it comes to highly unbalanced data. Stratification makes sure that the distribution of your targets is more or less the same in both the training and test datasets.

A stratified sampling strategy is used to make sure that the different subgroups in our population are represented in our samples. If my dataset is made up of 99% males and 1% females, a random sample of the population may end up having only males in it. So, you should separate the male and female populations first, and then take a sample from each one of the two and combine them later to make sure they are both represented in the final sample. The same concept is applied here if we want to make sure all the class labels are present in our training and test sets. Later on in this book, we will be splitting our data using the train_test_split()function. This function uses the class labels to stratify its samples by default.

Making sure the training and the test datasets are separate

One of the most common mistakes new data scientists may fall prey to is the look-ahead bias. We use the test dataset to simulate the data we will see in the future, but usually, the test dataset contains information that we can only know after time has passed. Take the case of our example space vehicles; we may have two columns—one saying whether the vehicle returns, and the other saying how long the vehicle will take to return. If we are to build a classifier to predict whether a vehicle will return, we will use the former column as our target, but we will never use the latter column as a feature. We can only know how long a vehicle stayed in outer space once it is actually back. This example looks trivial, but believe me, look-ahead bias is a very common mistake, especially when dealing with less obvious cases than this one.

Besides training, you also learn things from the data in order to preprocess it. Say, instead of users' heights in centimeters, you want to have a feature stating whether a user's height is above or below the median. To do that, you need to go through the data and calculate the median. Now, since anything that we learn has to come from the training set itself, we also need to learn this median from the training set and not from the entire dataset. Luckily, in all the data preprocessing functions of scikit-learn, there are separate methods for the fit(), predict(), and transform() functions. This makes sure that anything learned from the data (via the fit() method) is only learned from the training dataset, and then it can be applied to the test set (via the predict() and/or transform() methods).

Development set

When developing a model, we need to try multiple configurations of the model to decide which configuration gives the best results. To be able to do so, we usually split the training dataset further into training and development sets. Having two new subsets allows us to try different configurations when training on one of the two subsets and evaluating the effect of those configuration changes on the other. Once we find the best configuration, we evaluate our model with its final configuration on the test set. In Chapter 2, Making Decisions with Trees, we will do all this in practice. Note that I will be using the terms model configuration and hyperparameters interchangeably.

Evaluating our model

Evaluating your model's performance is essential in picking the best algorithm for the job and to be able to estimate how your model will perform in real life. As Box said, a model that is wrong can still be useful. Take the example of a web start-up. They run an ad campaign where they are paid $1 for each view they get, and they know that for every 100 viewers, only one viewer signs up and buys stuff for $50. In other words, they have to spend $100 to make $50. Obviously, that's a bad Return of Investment (ROI) for their business. Now, what if you create a model for them that can pick users for them to target, but your new model is only correct 10% of the time? Is 10% precision good or bad, in this case? Well, of course, this model is wrong 90% of the time, which may sound like a very bad model, but if we calculate ROI now, then for every $100 they spend, they make $500. Well, I would definitely pay you to build me this model that is quite wrong, yet quite useful!

scikit-learn provides a large number of evaluation metrics that we will be using to evaluate the models we build in this book. But remember, a metric is only useful if you really understand the problem you are solving and its business impact.

Deploying in production and monitoring

The main reason that many data scientists use Python for machine learning instead of R, for example, is that it makes it easier to productionize your code. Python has plenty of web frameworks to build APIs with and put the machine learning models behind. It is also supported by all cloud providers. I find it important that the team developing a model is also responsible for deploying it in production. Building your model in one language and then asking another team to port it into another language is error-prone. Of course, having one person or team building and deploying models may not be feasible in larger companies or due to other implementation constraints.

However, keeping the two teams in close contact and making sure that the ones developing the model can still understand the production code is essential and helps to minimize errors on account of development and production code inconsistency.

We try our best not to have any look-ahead bias when training our models. We hope data doesn't change after our models are trained, and we want our code to be bug-free. However, we cannot guarantee any of this. We may overlook the fact that the user's credit score is only added to the database after they make their first purchase. We may not know that our developers decided to switch to the metric system to specify our inventory's weights while it was saved in pounds when the model was trained. Because of that, it is important to log all the predictions your model makes to be able to monitor its performance in real life and compare it to the test set's performance. You can also log the test set's performance every time you retrain the model or keep track of the target's distribution over time.

Iterating

Often, when you deploy a model, you end up with more data. Furthermore, the performance of your model is not guaranteed to be the same when deployed in production. This can be due to some implementation issues or mistakes that took place during the evaluation process. Those two points mean that the first version of your solution is always up for improvement. Starting with simple solutions (that can be improved via iterations) is an important concept for agile programming and is a paramount concept for machine learning.

This whole process, from understanding theproblemto monitoring the ongoing improvements on the solution, requires tools that allow us to iterate quickly and efficiently. In the next section, we will introduce you to scikit-learn and explain why many machine learning practitioners consider it the right tool for the job.

When to use machine learning

"Pretty much anything that a normal person can do in less than 1 second, we can now automate with AI."
– Andrew Ng

One additional note before moving on to the next section is that when faced with a problem, you have to decide whether machine learning is apt for the task. Andrew Ng's 1-second rule is a good heuristic for you to estimate whether a machine learning-based solution will work. The main reason behind this is that computers are good with patterns. They are way better than humans at picking repeated patterns and acting on them.

Once they identify the same pattern over and over again, it is easy to codify them to make the same decisions every time. In the same manner, computers are also good with tactics. In 1908, Richard Teichmann stated that a game of chess is 99% basedontactics. Maybe that's why computers have beat humans in chess since 1997. If we are to believe Teichmann's statement, then the remaining 1% is strategy. Unlike tactics, strategy is the arena where humans beat machines. If the problem you want to solve can be formulated as a set of tactics, then go for machine learning and leave the strategic decisions for humans to make. In the end, most of our day-to-day decisions are tactical. Furthermore, one man's strategy is often someone else's tactics.

Introduction to scikit-learn

Since you have already picked up this book, you probably don't need me to convince you why machine learning is important. However, you may still have doubts about why to use scikit-learn in particular. You may encounter names such as TensorFlow, PyTorch, and Spark more often during your daily news consumption than scikit-learn. So, let me convince you of my preference for the latter.

It plays well with the Python data ecosystem

scikit-learn is a Python toolkit built on top of NumPy, SciPy, and Matplotlib. These choices mean that it fits well into your daily data pipeline. As a data scientist, Python is most likely your language of choice since it is good for both offline analysis and real-time implementations. You will also be using tools such as pandas to load data from your database, which allows you to perform a vast amount of transformation to your data. Since both pandas and scikit-learn are built on top of NumPy, they play very well with each other. Matplotlib is the de facto data visualization tool for Python, which means you can use its sophisticated data visualization capabilities to explore your data and unravel your model's ins and outs.

Since it is an open source tool that is heavily used in the community, it is very common to see other data tools use an almost identical interface to scikit-learn. Many of these tools are built on top of the same scientific Python libraries, and they are collectively known as SciKits (short for SciPyToolkits)—hence, the scikit prefix in scikit-learn. For example, scikit-image is a library for image processing, while categorical-encoding and imbalanced-learn are separate libraries for data preprocessing that are built as add-ons to scikit-learn.

We are going to use some of these tools in this book, and you will notice how easy it is to integrate these different tools into your workflow when using scikit-learn.

Being a key player in the Python data ecosystem is what makes scikit-learn the de facto toolset for machine learning. This is the tool that you will most likely hand your job application assignment to, as well as use for Kaggle competitions and to solve most of your professional day-to-day machine learning problems for your job.

Practical level of abstraction

scikit-learn implements a vast amount of machine learning, data processing, and model selection algorithms. These implementations are abstract enough, so you only need to apply minor changes when switching from one algorithm to another. This is a key feature since you will need to quickly iterate between different algorithms when developing a model to pick the best one for your problem. Having that said, this abstraction doesn't shield you from the algorithms' configurations. In other words, you are still in full control of your hyperparameters and settings.

When not to use scikit-learn

Most likely, the reasons to not use scikit-learn will include combinations of deep learning or scale. scikit-learn's implementation of neural networks is limited. Unlike scikit-learn, TensorFlow and PyTorch allow you to use a custom architecture, and they support GPUs for a massive training scale. All of scikit-learn's implementations run in memory on a single machine. I'd say that way more than 90% of businesses are at a scale where these constraints are fine. Data scientists can still fit their data in memory in large enough machines thanks to the cloud optionsavailable. They can cleverly engineer workarounds to deal with scaling issues, but if these limitations become something that they can no longer deal with, then they will need other tools to do the trick for them.

There are solutions being developed that allow scikit-learn to scale to multiple machines, such as Dask. Many scikit-learn algorithms allow parallel execution using joblib, which natively provides thread-based and process-based parallelism. Dask can scale these joblib-backed algorithms out to a cluster of machines by providing an alternative joblib backend.

Installing the packages you need

It's time to install the packages we will need in this book, but first of all, make sure you have Python installed on your computer. In this book, we will be using Python version 3.6. If your computer comes with Python 2.x installed, then you should upgrade Python to version 3.6 or later. I will show you how to install the required packages using pip, Python's de facto package-management system. If you use other package-management systems, such as Anaconda, you can easily find the equivalent installation commands for each of the following packages online.

To install scikit-learn, run the following command:

          $ pip install --upgrade scikit-learn==0.22
        

I will be using version 0.22 of scikit-learn here. You can add the --userswitch to the pip command to limit the installation to your own directories. This is important if you do not have root access to your machine or if you do not want to install the libraries globally. Furthermore, I prefer to create a virtual environment for each project I work on and install all the libraries I need for this project into that environment. You can check the documentation for Anaconda or Python's venv module to see how to create virtual environments.

Along with scikit-learn, we will need to install pandas. I will briefly introduce pandas in the next section, but for now, you can use the following command to install it:

          $ pip install --upgrade pandas==0.25.3
        

Optionally, you may need to install Jupyter. Jupyter notebooks allow you to write code in your browser and run bits of it in whichever order you want. This makes it ideal for experimentation and trying different parameters without the need to rerun the entire code every time. You can also plot graphs in your notebooks with the help of Matplotlib. Use the following commands to install both Jupyter and Matplotlib:

          $ pip install jupyter
          
$ pip install matplotlib

To start your Jupyter server, you can run jupyter notebookin your terminal, and then visit http://localhost:8888/in your browser.

We will make use of other libraries later on in the book. I'd rather introduce you to them when we need them and show you how to install each of them then.

Introduction to pandas

pandas is an open source library that provides data analysis tools for the Python programming language. If this definition doesn't tell you much, then you may think of pandas as Python's response to spreadsheets. I have decided to dedicate this section to pandas since you will be using it to create and load the data you are going to use in this book. You will also use pandas to analyze and visualize your data and alter the value of its columns before applying machine learning algorithms to it.

Tables in pandas are referred to as DataFrames. If you are an R programmer, then this name should be familiar to you. Now, let's start by creating a DataFrame for some polygon names and the number of sides each has:

# It's customary to call pandas pd when importing it
import pandas as pd

polygons_data_frame = pd.DataFrame(
{
'Name': ['Triangle', 'Quadrilateral', 'Pentagon', 'Hexagon'],
'Sides': [3, 4, 5, 6],
}
)

You can then use the head method to print the first N rows of your newly created DataFrame:

polygons_data_frame.head(3)

Here, you can see the first three rows of the DataFrame. In addition to the columns we specified, pandas add a default index:


Since we are programming in Python, we can also use the language's built-in function or even use our custom-built functions when creating a DataFrame. Here, we will use the range generator, rather than typing in all the possible side counts ourselves:

polygons = {
'Name': [
'Triangle', 'Quadrilateral', 'Pentagon', 'Hexagon', 'Heptagon', 'Octagon', 'Nonagon', 'Decagon', 'Hendecagon', 'Dodecagon', 'Tridecagon', 'Tetradecagon'
],
# Range parameters are the start, the end of the range and the step
'Sides': range(3, 15, 1),
}
polygons_data_frame = pd.DataFrame(polygons)

You can also sort your DataFrame by column. Here, we will sort it by polygon name in alphabetical order, and then print the first five polygons:

polygons_data_frame.sort_values('Name').head(5)

This time, we can see the first five rows of the DataFrame after it has been ordered by the names of the polygons in alphabetical order:

Feature engineering is the art of deriving new features by manipulating existing data. This is something that pandas is good at. In the following example, we are creating a new column, Length of Name, and adding the character lengths of each polygon's name:

polygons_data_frame[
'Length of Name'
] = polygons_data_frame['Name'].str.len()

We use str to be able to access the string functions to apply them to the values in the Name column. We then use the len method of a string. One other way to achieve the same result is to use the apply() function. If you call apply() on a column, you can get access to the values in the column. You can then apply any Python built-in or custom functions there. Here are two examples of how to use the apply() function.

Example 1 is as follows:

polygons_data_frame[
'Length of Name'
] = polygons_data_frame['Name'].apply(len)

Example 2 is as follows:

polygons_data_frame[
'Length of Name'
] = polygons_data_frame['Name'].apply(lambda n: len(n))

The good thing about the apply() method is that it allows you to run your own custom code anywhere, which is something you will need to use a lot when performing complex feature engineering. Nevertheless, the code you run using the apply() method isn't as optimized as the code in the first example. This is a clear case of flexibility versus performance trade-off that you should be aware of.

Finally, we can use the plotting capabilities provided by pandas and Matplotlib to see whether there is any correlation between the number of sides a polygon has and the length of its name:

# We use the DataFrame's plot method here, 
# where we specify that this is a scatter plot
# and also specify which columns to use for x and y
polygons_data_frame.plot(
title='Sides vs Length of Name',
kind='scatter',
x='Sides',
y='Length of Name',
)

Once we run the previous code, the following scatter plots will be displayed:

Scatter plots are generally useful for seeing correlations between two features. In the following plot, there is no clear correlation to be seen.

Python's scientific computing ecosystem conventions

Throughout this book, I will be using pandas, NumPy, SciPy, Matplotlib, and Seaborn. Any time you see the np, sp, pd, sns, and pltprefixes,you should assume that I have run the following import statements prior to the code:

import numpy as np
import scipy as sp
import pandas as pd
import seaborn as sns
import matplotlib.pyplot as plt

This is the de facto way of importing the scientific computing ecosystem into Python. If any of these libraries is missing on your computer, here is how to install them using pip:

          $ pip install --upgrade numpy==1.17.3
          
$ pip install --upgrade scipy==1.3.1
$ pip install --upgrade pandas==0.25.3
$ pip install --upgrade scikit-learn==0.22
$ pip install --upgrade matplotlib==3.1.2
$ pip install --upgrade seaborn==0.9.0

Usually, you do not need to specify the versions for each library; running pip install numpy will just install the latest stable version of the library. Nevertheless, pinning the version is good practice for reproducibility. It ensures the same results from the same code when it runs on different machines.

The code used in this book is written in Jupyter notebooks. I advise you to do the same on your machine. In general, the code should run smoothly in any other environment with very few changes when it comes to printing and displaying the results. If the figures are not shown in your Jupyter notebook, you may need to run the following line at least once in any cell at the beginning of your notebook:

          %matplotlib inline
        

Furthermore, randomness is quite common in many machine learning tasks. We may need to create random data to use with our algorithms. We may also randomly split this data into training and test sets. The algorithms themselves may use random values for initialization. There are tricks to make sure we all get the exact same results by using pseudo-random numbers. I will be using these tricks when needed sometimes, but other times, it would be better to make sure we get slightly different results to give you an idea of how things are not always deterministic and how to find ways to deal with underlying uncertainties. More on this later.

Summary

Mastering machine learning is a desirable skill nowadays given its vast application everywhere, from business to academia. Nevertheless, just understanding the theory of it will only take you so far since practitioners also need to understand their tools to be self-sufficient and capable.

In this chapter, we started with a high-level introduction to machine learning and learned when to use each of the machine learning types; from classification and regression to clustering and reinforcement learning. We then learned about scikit-learn and why practitioners recommend it when solving both supervised and unsupervised learning problems. To keep this book self-sufficient, we also covered the basics of data manipulation for those who haven't used libraries such as pandas and Matplotlib before. In the following chapters, we will continue to combine our understanding of the underlying theory of machine learning with more practical examples using scikit-learn.

The first two parts of this book will cover supervised machine learning algorithms. The first part will cover basic algorithms, as well as some other machine learning basics, such as data splitting and preprocessing. Then, we will move on to more advanced topics in the second part. The third and final part will cover unsupervised learning and topics such as anomaly detection and recommendation engines.

So that this book remains a practical guide, I have made sure to provide examples in each chapter. I also did not want to separate the data preparation from model creation. Although topics such as data splitting, feature selection, data scaling, and model evaluation are key concepts to know about, we usually deal with them as part of an overall whole solution. I also feel that those concepts are best understood in their correct context. That's why, within each chapter, I will be covering one main algorithm but will use some examples to shed light on some other concepts along the way.

This means that it is up to you whether you read this book from cover to cover or use it as a reference and jump straight to the algorithms you want to know about when you need them. Nevertheless, I advise that you skim through all the chapters, even if you already know about the algorithm covered there or don't need to know about it at the moment.

I hope that you are now ready for the next chapter, where we will start by looking at decision trees and learn how to use them to solve different classification and regression problems.

Further reading

Left arrow icon Right arrow icon
Download code icon Download Code

Key benefits

  • Delve into machine learning with this comprehensive guide to scikit-learn and scientific Python
  • Master the art of data-driven problem-solving with hands-on examples
  • Foster your theoretical and practical knowledge of supervised and unsupervised machine learning algorithms

Description

Machine learning is applied everywhere, from business to research and academia, while scikit-learn is a versatile library that is popular among machine learning practitioners. This book serves as a practical guide for anyone looking to provide hands-on machine learning solutions with scikit-learn and Python toolkits. The book begins with an explanation of machine learning concepts and fundamentals, and strikes a balance between theoretical concepts and their applications. Each chapter covers a different set of algorithms, and shows you how to use them to solve real-life problems. You’ll also learn about various key supervised and unsupervised machine learning algorithms using practical examples. Whether it is an instance-based learning algorithm, Bayesian estimation, a deep neural network, a tree-based ensemble, or a recommendation system, you’ll gain a thorough understanding of its theory and learn when to apply it. As you advance, you’ll learn how to deal with unlabeled data and when to use different clustering and anomaly detection algorithms. By the end of this machine learning book, you’ll have learned how to take a data-driven approach to provide end-to-end machine learning solutions. You’ll also have discovered how to formulate the problem at hand, prepare required data, and evaluate and deploy models in production.

Who is this book for?

This book is for data scientists, machine learning practitioners, and anyone who wants to learn how machine learning algorithms work and to build different machine learning models using the Python ecosystem. The book will help you take your knowledge of machine learning to the next level by grasping its ins and outs and tailoring it to your needs. Working knowledge of Python and a basic understanding of underlying mathematical and statistical concepts is required.

What you will learn

  • Understand when to use supervised, unsupervised, or reinforcement learning algorithms
  • Find out how to collect and prepare your data for machine learning tasks
  • Tackle imbalanced data and optimize your algorithm for a bias or variance tradeoff
  • Apply supervised and unsupervised algorithms to overcome various machine learning challenges
  • Employ best practices for tuning your algorithm's hyper parameters
  • Discover how to use neural networks for classification and regression
  • Build, evaluate, and deploy your machine learning solutions to production

Product Details

Country selected
Publication date, Length, Edition, Language, ISBN-13
Publication date : Jul 24, 2020
Length: 384 pages
Edition : 1st
Language : English
ISBN-13 : 9781838823580
Category :
Languages :

What do you get with eBook?

Product feature icon Instant access to your Digital eBook purchase
Product feature icon Download this book in EPUB and PDF formats
Product feature icon Access this title in our online reader with advanced features
Product feature icon DRM FREE - Read whenever, wherever and however you want
Product feature icon AI Assistant (beta) to help accelerate your learning
Modal Close icon
Payment Processing...
tick Completed

Billing Address

Product Details

Publication date : Jul 24, 2020
Length: 384 pages
Edition : 1st
Language : English
ISBN-13 : 9781838823580
Category :
Languages :

Packt Subscriptions

See our plans and pricing
Modal Close icon
$19.99 billed monthly
Feature tick icon Unlimited access to Packt's library of 7,000+ practical books and videos
Feature tick icon Constantly refreshed with 50+ new titles a month
Feature tick icon Exclusive Early access to books as they're written
Feature tick icon Solve problems while you work with advanced search and reference features
Feature tick icon Offline reading on the mobile app
Feature tick icon Simple pricing, no contract
$199.99 billed annually
Feature tick icon Unlimited access to Packt's library of 7,000+ practical books and videos
Feature tick icon Constantly refreshed with 50+ new titles a month
Feature tick icon Exclusive Early access to books as they're written
Feature tick icon Solve problems while you work with advanced search and reference features
Feature tick icon Offline reading on the mobile app
Feature tick icon Choose a DRM-free eBook or Video every month to keep
Feature tick icon PLUS own as many other DRM-free eBooks or Videos as you like for just $5 each
Feature tick icon Exclusive print discounts
$279.99 billed in 18 months
Feature tick icon Unlimited access to Packt's library of 7,000+ practical books and videos
Feature tick icon Constantly refreshed with 50+ new titles a month
Feature tick icon Exclusive Early access to books as they're written
Feature tick icon Solve problems while you work with advanced search and reference features
Feature tick icon Offline reading on the mobile app
Feature tick icon Choose a DRM-free eBook or Video every month to keep
Feature tick icon PLUS own as many other DRM-free eBooks or Videos as you like for just $5 each
Feature tick icon Exclusive print discounts

Frequently bought together


Stars icon
Total $ 137.97
Hands-On Mathematics for Deep Learning
$45.99
Hands-On Python Natural Language Processing
$45.99
Hands-On Machine Learning with scikit-learn and Scientific Python Toolkits
$45.99
Total $ 137.97 Stars icon

Table of Contents

17 Chapters
Section 1: Supervised Learning Chevron down icon Chevron up icon
Introduction to Machine Learning Chevron down icon Chevron up icon
Making Decisions with Trees Chevron down icon Chevron up icon
Making Decisions with Linear Equations Chevron down icon Chevron up icon
Preparing Your Data Chevron down icon Chevron up icon
Image Processing with Nearest Neighbors Chevron down icon Chevron up icon
Classifying Text Using Naive Bayes Chevron down icon Chevron up icon
Section 2: Advanced Supervised Learning Chevron down icon Chevron up icon
Neural Networks – Here Comes Deep Learning Chevron down icon Chevron up icon
Ensembles – When One Model Is Not Enough Chevron down icon Chevron up icon
The Y is as Important as the X Chevron down icon Chevron up icon
Imbalanced Learning – Not Even 1% Win the Lottery Chevron down icon Chevron up icon
Section 3: Unsupervised Learning and More Chevron down icon Chevron up icon
Clustering – Making Sense of Unlabeled Data Chevron down icon Chevron up icon
Anomaly Detection – Finding Outliers in Data Chevron down icon Chevron up icon
Recommender System – Getting to Know Their Taste Chevron down icon Chevron up icon
Other Books You May Enjoy Chevron down icon Chevron up icon

Customer reviews

Rating distribution
Full star icon Full star icon Full star icon Full star icon Half star icon 4.8
(4 Ratings)
5 star 75%
4 star 25%
3 star 0%
2 star 0%
1 star 0%
Adam Powell Sep 21, 2020
Full star icon Full star icon Full star icon Full star icon Full star icon 5
The perfect read for an analyst that wants to transition into machine learning. It broadly covers all the key algorithms with an insightful practitioner's perspective. Highly recommended!
Amazon Verified review Amazon
Sara Oct 25, 2020
Full star icon Full star icon Full star icon Full star icon Full star icon 5
This book is an excellent introductory book for data scientists learning machine learning and any curious people wanting to know what it takes to develop and build machine learning algorithms.The book covers the basic concepts, the terminology, and goes into detail about implementing these algorithms using Python and one of the most well-known machine learning libraries Scikit-learn.The book introduces these complex concepts is straightforward and easy to understand, even if the reader doesn't have any maths background.It contains many real-life applications of machine learning with code that the reader can follow and use to build more significant applications.I would recommend this book to anyone getting started with machine learning. This book will give you the concrete knowledge you need to start building your own machine learning applications.
Amazon Verified review Amazon
Przemyslaw Chojecki Sep 02, 2020
Full star icon Full star icon Full star icon Full star icon Full star icon 5
If you've already did a couple of data science projects, had a basic understanding of Python, did some visualisation and want to go deeper into some details of what it means to analyse data, then this book is for you.This is a practical guide to both supervised and unsupervised learning with plenty of examples in code.The main focus is on imperfect data and how to make sense of these imperfections through various machine learning algorithms.The author discusses standard data science algorithms using scikit-learn library which gives a coherent overview of the subjest. You will learn decision trees, KNN classification, Naive Bayes and much more; applied to classical datasets like Iris dataset, Boston housing prices or Fashion-MNIST.Recommended for beginning data scientists!
Amazon Verified review Amazon
Matthew Emerick Aug 10, 2020
Full star icon Full star icon Full star icon Full star icon Empty star icon 4
About This BookThis is a guide for newcomers to machine learning who want to start learning one of the core Python ML libraries. This book focuses on scikit-learn, though discusses other related libraries as needed. We see several algorithms developed from the ground up, which aids in understanding what is going on and why things work the way they do.Who is This For?The author makes the following claim, taken directly from the preface: "This book is for machine learning data scientists who want to master the theoretical and practical sides of machine learning algorithms and understand how to use them to solve real-life problems." This a big claim for a 384 page introductory book.Why Was This Written?scikit-learn is a powerful library that is essential for machine learning in Python. Every ML developer needs to learn the basics, and this can be a good book for that. Several machine learning algorithms, both supervised and unsupervised, are covered in a fair amount of detail. As was mentioned, the book intends the reader to master machine learning and does indeed introduce the reader to important terms, algorithms, and some of the theory.OrganizationThe book starts out with a very brief introduction to machine learning, finishing up the chapter with instructions on how to set up your computer to run the included code. The book then surges forward by discussing its first algorithm. I did find it odd that a chapter on preparing your data is found after the first couple algorithms. The book focuses on supervised machine learning with only the last three chapters discussing unsupervised learning.Did This Book Succeed?I think that the computer setup would have been better left in the preface while the ML introduction could have been expanded. After reading this book, the reader will have an understanding of a selection of algorithms, enough to get a junior software developer role on a team, but will need to dig deeper to a better understanding. If you simply want to learn a bit about the subject, then this is a good book.Rating and Final ThoughtsThis is a useful book, but I feel it misses the mark by trying to do too many things. If one were to truly master machine learning, this book might be an aid early on, but is only one step. Important concepts were discussed, and even bolded, but there was no glossary at the end to make it easy to look up the terms later on; you have to use the index to find where the term was originally used and look there. There are a great many algorithms not discussed and theory left out.I have to give this book a 3.5 out of 5. It's useful, especially to the ML beginner, but it misses its own goal. A cookbook style might have worked better, focusing on either ML or scikit-learn.
Amazon Verified review Amazon
Get free access to Packt library with over 7500+ books and video courses for 7 days!
Start Free Trial

FAQs

How do I buy and download an eBook? Chevron down icon Chevron up icon

Where there is an eBook version of a title available, you can buy it from the book details for that title. Add either the standalone eBook or the eBook and print book bundle to your shopping cart. Your eBook will show in your cart as a product on its own. After completing checkout and payment in the normal way, you will receive your receipt on the screen containing a link to a personalised PDF download file. This link will remain active for 30 days. You can download backup copies of the file by logging in to your account at any time.

If you already have Adobe reader installed, then clicking on the link will download and open the PDF file directly. If you don't, then save the PDF file on your machine and download the Reader to view it.

Please Note: Packt eBooks are non-returnable and non-refundable.

Packt eBook and Licensing When you buy an eBook from Packt Publishing, completing your purchase means you accept the terms of our licence agreement. Please read the full text of the agreement. In it we have tried to balance the need for the ebook to be usable for you the reader with our needs to protect the rights of us as Publishers and of our authors. In summary, the agreement says:

  • You may make copies of your eBook for your own use onto any machine
  • You may not pass copies of the eBook on to anyone else
How can I make a purchase on your website? Chevron down icon Chevron up icon

If you want to purchase a video course, eBook or Bundle (Print+eBook) please follow below steps:

  1. Register on our website using your email address and the password.
  2. Search for the title by name or ISBN using the search option.
  3. Select the title you want to purchase.
  4. Choose the format you wish to purchase the title in; if you order the Print Book, you get a free eBook copy of the same title. 
  5. Proceed with the checkout process (payment to be made using Credit Card, Debit Cart, or PayPal)
Where can I access support around an eBook? Chevron down icon Chevron up icon
  • If you experience a problem with using or installing Adobe Reader, the contact Adobe directly.
  • To view the errata for the book, see www.packtpub.com/support and view the pages for the title you have.
  • To view your account details or to download a new copy of the book go to www.packtpub.com/account
  • To contact us directly if a problem is not resolved, use www.packtpub.com/contact-us
What eBook formats do Packt support? Chevron down icon Chevron up icon

Our eBooks are currently available in a variety of formats such as PDF and ePubs. In the future, this may well change with trends and development in technology, but please note that our PDFs are not Adobe eBook Reader format, which has greater restrictions on security.

You will need to use Adobe Reader v9 or later in order to read Packt's PDF eBooks.

What are the benefits of eBooks? Chevron down icon Chevron up icon
  • You can get the information you need immediately
  • You can easily take them with you on a laptop
  • You can download them an unlimited number of times
  • You can print them out
  • They are copy-paste enabled
  • They are searchable
  • There is no password protection
  • They are lower price than print
  • They save resources and space
What is an eBook? Chevron down icon Chevron up icon

Packt eBooks are a complete electronic version of the print edition, available in PDF and ePub formats. Every piece of content down to the page numbering is the same. Because we save the costs of printing and shipping the book to you, we are able to offer eBooks at a lower cost than print editions.

When you have purchased an eBook, simply login to your account and click on the link in Your Download Area. We recommend you saving the file to your hard drive before opening it.

For optimal viewing of our eBooks, we recommend you download and install the free Adobe Reader version 9.

Modal Close icon
Modal Close icon