
Understanding common discrete probability distributions
In this section, we will introduce you to some of the most important and common distributions. I will first demonstrate some examples and the mechanism behind them that exhibits corresponding probability. Then I will calculate the expectation and variance of the distribution, show you samples that generated from the probability, and plot its histogram plot and boxplot.
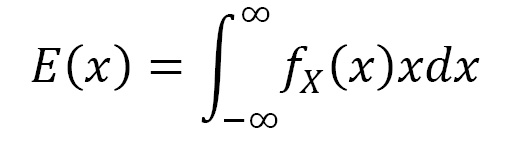
The expectation of X that follows a distribution is the mean value that X can take. For example, with PDF  the mean is calculated as follows:
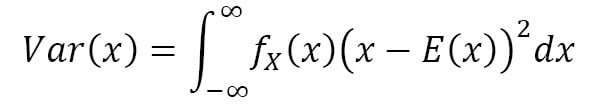
The variance measures the spreading behavior of the distribution and is calculated as follows:
μ and σ2 are the common symbols for expectation and variance.
X is called a random variable. Note that it is the outcome of a random experiment. However, not all random variables represent outcomes of events. For example, you can take Y = exp(X), and Y is also...