Data Manipulation
Now that we have deconstructed the structure of the pandas DataFrame down to its basics, the rest of the wrangling tasks, that is, creating new DataFrames, selecting or slicing a DataFrame into its parts, filtering DataFrames for some values, joining different DataFrames, and so on, will become very intuitive.
Selecting and Filtering in pandas
It is standard convention in spreadsheets to address a cell by (column name, row name). Since data is stored in pandas in a similar manner, this is also the way to address a cell in a pandas DataFrame: the column name acts as a key to give you the pandas Series, and the row name gives you the value on that index of the DataFrame.
But if you need to access more than a single cell, such as a subset of some rows and columns from the DataFrame, or change the order of display of some columns on the DataFrame, you can make use of the syntax listed in the following table:
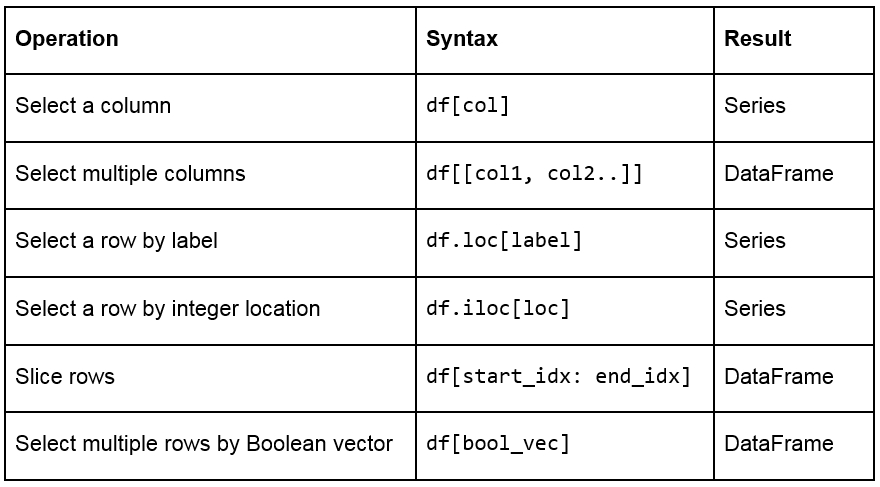
Figure 1.18: A table listing the syntax used for different operations on a pandas DataFrame
Creating Test DataFrames in Python
We frequently need to create test objects while building a data pipeline in pandas. Test objects give us a reference point to figure out what we have been able to do up till that point and make it easier to debug our scripts. Generally, test DataFrames are small in size, so that the output of every process is quick and easy to compute. There are two ways to create test DataFrames—by creating completely new DataFrames, or by duplicating or taking a slice of a previously existing DataFrame:
Creating new DataFrames: We typically use the DataFrame method to create a completely new DataFrame. The function directly converts a Python object into a pandas DataFrame. The DataFrame function will, in general, work with any iterable collection of data (such as dict, list, and so on). We can also pass an empty collection or a singleton collection to the function.
For example, we will get the same DataFrame through either of the following lines of code:
pd.DataFrame({'category': pd.Series([1, 2, 3])}
pd.DataFrame([1, 2, 3], columns=['category'])
pd.DataFrame.from_dict({'category': [1, 2, 3]})
The following figure shows the outputs received each time:

Figure 1.19: Output generated by all three ways to create a DataFrame
A DataFrame can also be built by passing any pandas objects to the DataFrame function. The following line of code gives the same output as the preceding figure:
pd.DataFrame(pd.Series([1,2,3]), columns=["category"])
Duplicating or slicing a previously existing DataFrame: The second way to create a test DataFrame is by copying a previously existing DataFrame. Python, and therefore, pandas, has shallow references. When we say obj1 = obj2, the objects share the location or the reference to the same object in memory. So, if we change obj2, obj1 also gets modified, and vice versa. This is tackled in the standard library with the deepcopy function in the copy module. The deepcopy function allows the user to recursively go through the objects being pointed to by the references and create entirely new objects.
So, when you want to copy a previously existing DataFrame and don't want the previous DataFrame to be affected by modifications in the current DataFrame, you need to use the deepcopy function. You can also slice the previously existing DataFrame and pass it to the function, and it will be considered a new DataFrame. For example, the following code snippet will recursively copy everything in df1 and not have any references to it when you make changes to df:
import pandas
import copy
df = copy.deepcopy(df1)
Adding and Removing Attributes and Observations
pandas provides the following functions to add and delete rows (observations) and columns (attributes):
df['col'] = s: This adds a new column, col, to the DataFrame, df, with the Series, s.
df.assign(c1 = s1, c2 = s2...): This adds new columns, c1, c2, and so on, with series, s1, s2, and so on, to the df DataFrame in one go.
df.append(df2 / d2, ignore_index): This adds values from the df2 DataFrame to the bottom of the df DataFrame wherever the columns of df2 match those of df. Alternatively, it also accepts dict and d2, and if ignore_index = True, it does not use index labels.
df.drop(labels, axis): This remove the rows or columns specified by the labels and corresponding axis, or those specified by the index or column names directly.
df.dropna(axis, how): Depending on the parameter passed to how, this decides whether to drop rows (or columns if axis = 1) with missing values in any of the fields or in all of the fields. If no parameter is passed, the default value of how is any and the default value of axis is 0.
df.drop_duplicates(keep): This removes rows with duplicate values in the DataFrame, and keeps the first (keep = 'first'), last (keep = 'last'), or no occurrence (keep = False) in the data.
We can also combine different pandas DataFrames sequentially with the concat function, as follows:
pd.concat([df1,df2..]): This creates a new DataFrame with df1, df2, and all other DataFrames combined sequentially. It will automatically combine columns having the same names in the combined DataFrames.
Exercise 3: Creating and Modifying Test DataFrames
This exercise aims to test the understanding of the students about creating and modifying DataFrames in pandas. We will create a test DataFrame from scratch and add and remove rows/columns to it by making use of the functions and concepts described so far:
Import pandas and copy libraries that we will need for this task (the copy module in this case):
import pandas as pd
import copy
Create a DataFrame, df1, and use the head method to see the first few rows of the DataFrame. Use the following code:
df1 = pd.DataFrame({'category': pd.Series([1, 2, 3])})
df1.head()
Your output should be as follows:

Figure 1.20: The first few rows of df1
Create a test DataFrame, df, by duplicating df1. Use the deepcopy function:
df = copy.deepcopy(df1)
df.head()
You should get the following output:

Figure 1.21: The first few rows of df
Add a new column, cities, containing different kinds of city groups to the test DataFrame using the following code and take a look at the DataFrame again:
df['cities'] = pd.Series([['Delhi', 'Mumbai'], ['Lucknow', 'Bhopal'], ['Chennai', 'Bangalore']])
df.head()
You should get the following output:

Figure 1.22: Adding a row to df
Now, add multiple columns pertaining to the user viewership using the assign function and again look at the data. Use the following code:
df.assign(
    young_viewers = pd.Series([2000000, 3000000, 1500000]),
    adult_viewers = pd.Series([2500000, 3500000, 1600000]),
    aged_viewers = pd.Series([2300000, 2800000, 2000000])
)
df.head()
Your DataFrame will now appear as follows:

Figure 1.23: Adding multiple columns to df
Use the append function to add a new row to the DataFrame. As we know that the new row contains partial information, we will pass the ignore_index parameter as True:
df.append({'cities': ["Kolkata", "Hyderabad"], 'adult_viewers': 2000000,
   'aged_viewers': 2000000, 'young_viewers': 1500000}, ignore_index = True)
df.head()
Your DataFrame should now look as follows:

Figure 1.24: Adding another row by using the append function on df
Now, use the concat function to duplicate the test DataFrame and save it as df2. Take a look at the new DataFrame:
df2 = pd.concat([df, df], sort = False)
df2
df2 will show duplicate entries of df1, as shown here:

Figure 1.25: Using the concat function to duplicate a DataFrame, df2, in pandas
To delete a row from the df DataFrame, we will now pass the index of the row we want to delete—in this case, the third row—to the drop function, as follows:
df.drop([3])
You will get the following output:

Figure 1.26: Using the drop function to delete a row
Similarly, let's delete the aged_viewers column from the DataFrame. We will pass the column name as the parameter to the drop function and specify the axis as 1:
df.drop(['aged_viewers'])
Your output will be as follows:

Figure 1.27: Dropping the aged_viewers column in the DataFrame
Note that, as the result of the drop function is also a DataFrame, we can chain another function on it too. So, we drop the cities field from df2 and remove the duplicates in it as well:
df2.drop('cities', axis = 1).drop_duplicates()The df2 DataFrame will now look as follows:

Figure 1.28: Dropping the cities field and then removing duplicates in df2
Congratulations! You've successfully performed some basic operations on a DataFrame. You now know how to add rows and columns to DataFrames and how to concatenate multiple DataFrames together in a big DataFrame.
In the next section, you will learn how to combine multiple data sources into the same DataFrame. When combining data sources, we need to make sure to include common columns from both sources but make sure that no duplication occurs. We would also need to make sure that, unlike the concat function, the combined DataFrame is smart about the index and does not duplicate rows that already exist. This feature is also covered in the next section.
Combining Data
Once the data is prepared from multiple sources in separate pandas DataFrames, we can use the pd.merge function to combine them into the same DataFrame based on a relevant key passed through the on parameter. It is possible that the joining key is named differently in the different DataFrames that are being joined. So, while calling pd.merge(df, df1), we can provide a left_on parameter to specify the column to be merged from df and a right_on parameter to specify the index in df1.
pandas provides four ways of combining DataFrames through the how parameter. All values of these are different joins by themselves and are described as follows:
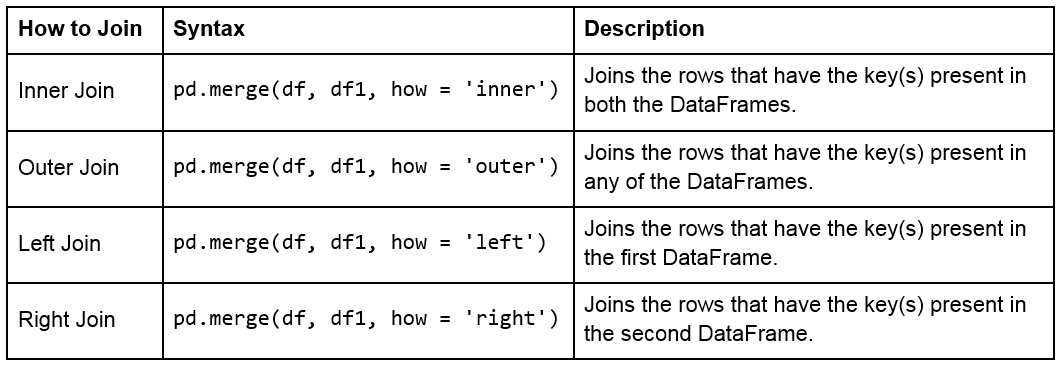
Figure 1.29: Table describing different joins
The following figure shows two sample DataFrames, df1 and df2, and the results of the various joins performed on these DataFrames:
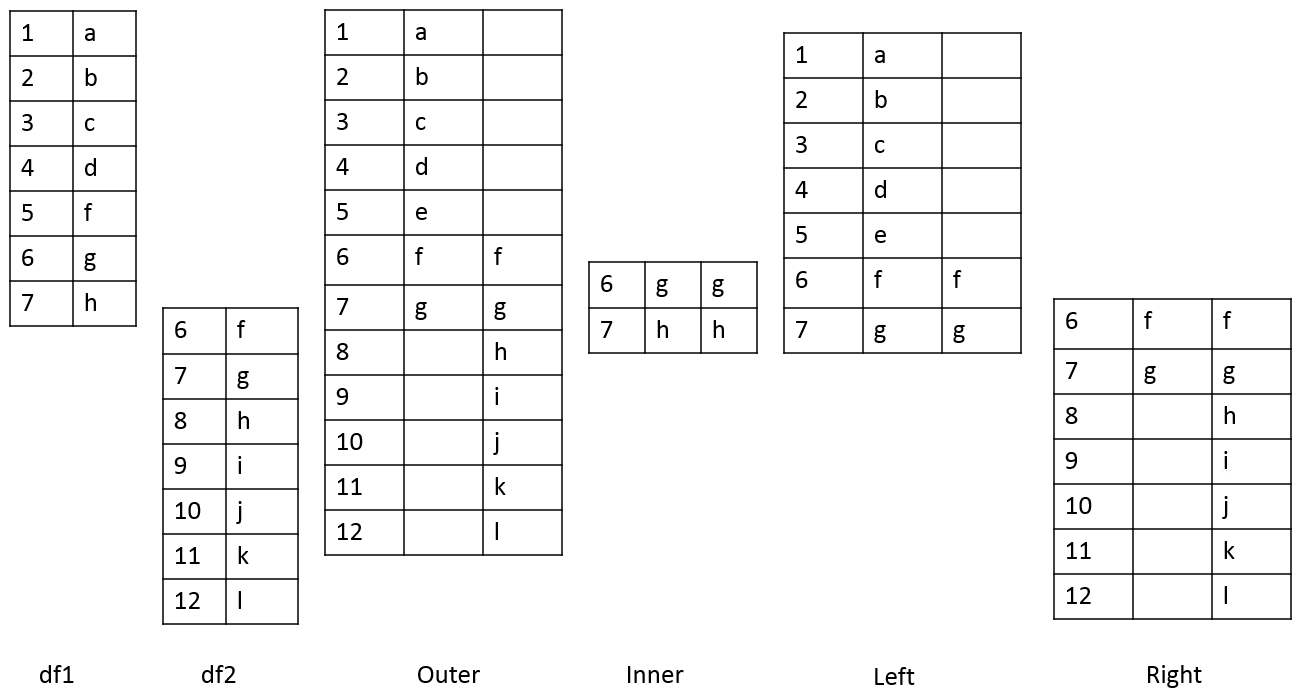
Figure 1.30: Table showing two DataFrames and the outcomes of different joins on them
For example, we can perform a right and outer join on the DataFrames of the previous exercise using the following code:
pd.merge(df, df1, how = 'right')
pd.merge(df, df1, how = 'outer')
The following will be the output of the preceding two joins:
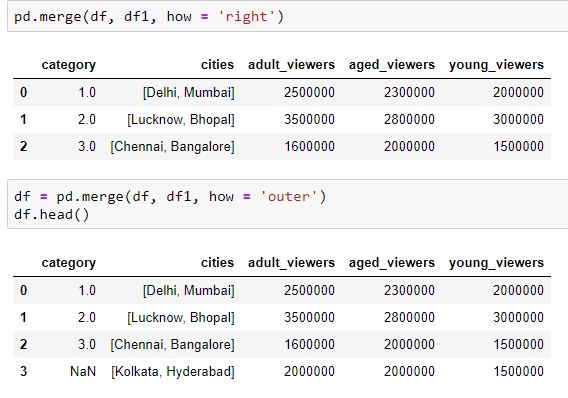
Figure 1.31: Examples of the different types of merges in pandas
Handling Missing Data
Once we have joined two datasets, it is easy to see what happens to an index present in one of the tables but not in the other. The other columns of that index get the np.nan value, which is pandas' way of telling us that data is missing in that column. Depending on where and how the values are going to be used, missing values can be treated differently. The following are various ways of treating missing values:
We can get rid of missing values completely using df.dropna, as explained in the Adding and Removing Attributes and Observations section.
We can also replace all the missing values at once using df.fillna(). The value we want to fill in will depend heavily on the context and the use case for the data. For example, we can replace all missing values with the mean or median of the data, or even some easy to filter values, such as –1 using df.fillna(df.mean()),df.fillna(df.median), or df.fillna(-1), as shown here:

Figure 1.32: Using the df.fillna function
We can interpolate missing values using the interpolate function:

Figure 1.33: Using the interpolate function to predict category
Other than using in-built operations, we can also perform different operations on DataFrames by filtering out rows with missing values in the following ways:
We can check for slices containing missing values using the pd.isnull() function, or those without it using the pd.isnotnull() function, respectively:
df.isnull()
You should get the following output:

Figure 1.34: Using the .isnull function
We can check whether individual elements are NA using the isna function:
df[['category']].isna
This will give you the following output:

Figure 1.35: Using the isna function
This describes missing values only in pandas. You might come across different types of missing values in your pandas DataFrame if it gets data from different sources, for example, None in databases. You'll have to filter them out separately, as described in previous sections, and proceed.
Exercise 4: Combining DataFrames and Handling Missing Values
The aim of this exercise is to get you used to combining different DataFrames and handling missing values in different contexts, as well as to revisit how to create DataFrames. The context is to get user information about users definitely watching a certain webcast on a website so that we can recognize patterns in their behavior:
Import the numpy and pandas modules, which we'll be using:
importnumpy as np
import pandas as pd
Create two empty DataFrames, df1 and df2:
df1 = pd.DataFrame()
df2 = pd.DataFrame()
We will now add dummy information about the viewers of the webcast in a column named viewers in df1, and the people using the website in a column named users in df2. Use the following code:
df1['viewers'] = ["Sushmita", "Aditya", "Bala", "Anurag"]
df2['users'] = ["Aditya", "Anurag", "Bala", "Sushmita", "Apoorva"]
We will also add a couple of additional columns to each DataFrame. The values for these can be added manually or sampled from a distribution, such as normal distribution through NumPy:
np.random.seed(1729)
df1 = df1.assign(views = np.random.normal(100, 100, 4))
df2 = df2.assign(cost = [20, np.nan, 15, 2, 7])
View the first few rows of both DataFrames, still using the head method:
df1.head()
df2.head()
You should get the following outputs for both df1 and df2:

Figure 1.36: Contents of df1 and df2
Do a left join of df1 with df2 and store the output in a DataFrame, df, because we only want the user stats in df2 of those users who are viewing the webcast in df1. Therefore, we also specify the joining key as "viewers" in df1 and "users" in df2:
df = df1.merge(df2, left_on="viewers", right_on="users", how="left")
df.head()
Your output should now look as follows:

Figure 1.37: Using the merge and fillna functions
You'll observe some missing values (NaN) in the preceding output. We will handle these values in the DataFrame by replacing them with the mean values in that column. Use the following code:
df.fillna(df.mean())
Your output will now look as follows:

Figure 1.38: Imputing missing values with the mean through fillna
Congratulations! You have successfully wrangled with data in data pipelines and transformed attributes externally. But to handle the sales.xlsx file that we saw previously, this is still not enough. We need to apply functions and operations on the data inside the DataFrame too. Let's learn how to do that and more in the next section.
Applying Functions and Operations on DataFrames
By default, operations on all pandas objects are element-wise and return the same type of pandas objects. For instance, look at the following code:
df['viewers'] = df['adult_viewers']+df['aged_viewers']+df['young_viewers']
This will add a viewers column to the DataFrame with the value for each observation being equal to the sum of the values in the adult_viewers, aged_viewers, and young_viewers columns.
Similarly, the following code will multiply every numerical value in the viewers column of the DataFrame by 0.03 or whatever you want to keep as your target CTR (click-through rate):
df['expected clicks'] = 0.03*df['viewers']
Hence, your DataFrame will look as follows once these operations are performed:

Figure 1.39: Operations on pandas DataFrames
Pandas also supports several out-of-the-box built-in functions on pandas objects. These are listed in the following table:
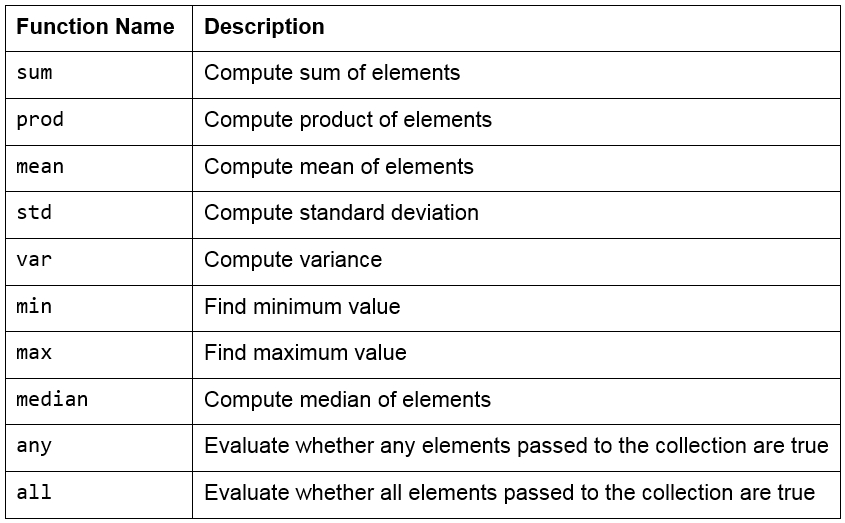
Figure 1.40: Built-in functions used in pandas
Note
Remember that pandas objects are Python objects too. Therefore, we can write our own custom functions to perform specific tasks on them.
We can iterate through the rows and columns of pandas objects using itertuples or iteritems. Consider the following DataFrame, named df:

Figure 1.41: DataFrame df
The following methods can be performed on this DataFrame:
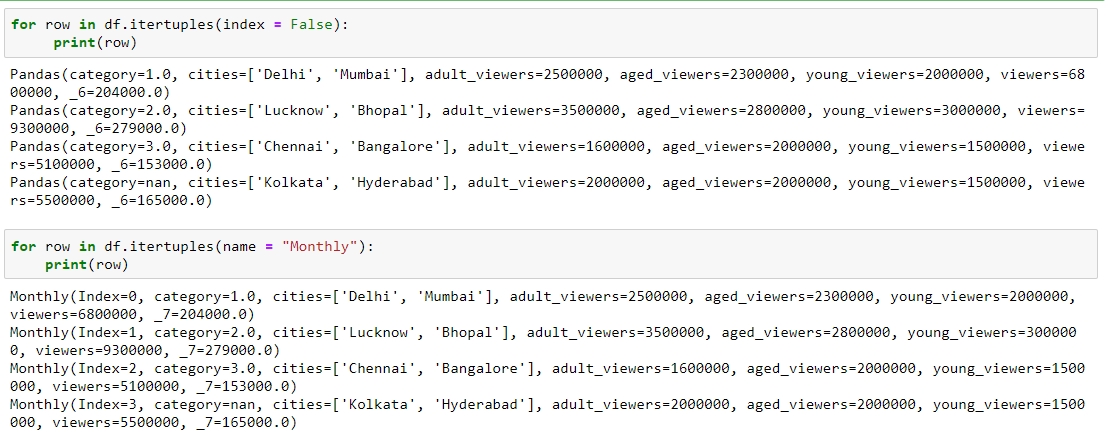
Figure 1.42: Testing itertuples

Figure 1.43: Testing iterrows
itertuples: This method iterates over the rows of the DataFrame in the form of named tuples. By setting the index parameter to False, we can remove the index as the first element of the tuple and set a custom name for the yielded named tuples by setting it in the name parameter. The following screenshot illustrates this over the DataFrame shown in the preceding figure:
iterrows: This method iterates over the rows of the DataFrame in tuples of the type (label, content), where label is the index of the row and content is a pandas Series containing every item in the row. The following screenshot illustrates this:
iteritems: This method iterates over the columns of the DataFrame in tuples of the type (label,content), where label is the name of the column and content is the content in the column in the form of a pandas Series. The following screenshot shows how this is performed:

Figure 1.44: Checking out iteritems
To apply built-in or custom functions to pandas, we can make use of the map and apply functions. We can pass any built-in, NumPy, or custom functions as parameters to these functions, and they will be applied to all elements in the column:
map: This returns an object of the same kind as that was passed to it. A dictionary can also be passed as input to it, as shown here:

Figure 1.45: Using the map function
apply: This applies the function to the object passed and returns a DataFrame. It can easily take multiple columns as input. It also accepts the axis parameter, depending on how the function is to be applied, as shown:

Figure 1.46: Using the apply function
Other than working on just DataFrames and Series, functions can also be applied to pandas GroupBy objects. Let's see how that works.
Grouping Data
Suppose you want to apply a function differently on some rows of a DataFrame, depending on the values in a particular column in that row. You can slice the DataFrame on the key(s) you want to aggregate on and then apply your function to that group, store the values, and move on to the next group.
pandas provides a much better way to do this, using the groupby function, where you can pass keys for groups as a parameter. The output of this function is a DataFrameGroupBy object that holds groups containing values of all the rows in that group. We can select the new column we would like to apply a function to, and pandas will automatically aggregate the outputs on the level of different values on its keys and return the final DataFrame with the functions applied to individual rows.
For example, the following will collect the rows that have the same number of aged_viewers together, take their values in the expected clicks column, and add them together:

Figure 1.47: Using the groupby function on a Series
Instead, if we were to pass [['series']] to the GroupBy object, we would have gotten a DataFrame back, as shown:
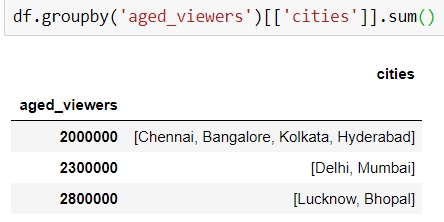
Figure 1.48: Using the groupby function on a DataFrame
Exercise 5: Applying Data Transformations
The aim of this exercise is to get you used to performing regular and groupby operations on DataFrames and applying functions to them. You will use the user_info.json file in the Lesson02 folder on GitHub, which contains information about six customers.
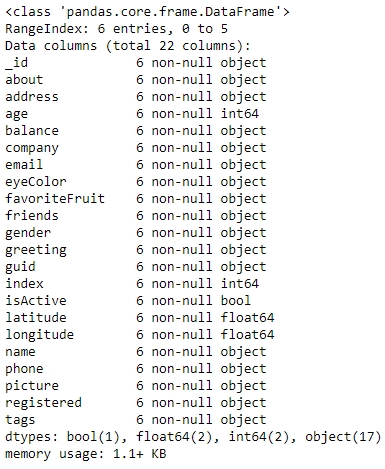
Figure 1.50: Output of the info function on user_info
Import the pandas module that we'll be using:
import pandas as pd
Read the user_info.json file into a pandas DataFrame, user_info, and look at the first few rows of the DataFrame:
user_info = pd.read_json('user_info.json')
user_info.head()
You will get the following output:

Figure 1.49: Output of the head function on user_info
Now, look at the attributes and the data inside them:
user_info.info()
You will get the following output:
Let's make use of the map function to see how many friends each user in the data has. Use the following code:
user_info['friends'].map(lambda x: len(x))
You will get the following output:

Figure 1.51: Using the map function on user_info
We use the apply function to get a grip on the data within each column individually and apply regular Python functions to it. Let's convert all the values in the tags column of the DataFrame to capital letters using the upper function for strings in Python, as follows:
user_info['tags'].apply(lambda x: [t.upper() for t in x])
You should get the following output:

Figure 1.52: Converting values in tags
Use the groupby function to get the different values obtained by a certain attribute. We can use the count function on each such mini pandas DataFrame generated. We'll do this first for the eye color:
user_info.groupby('eyeColor')['_id'].count()Your output should now look as follows:

Figure 1.53: Checking distribution of eyeColor
Similarly, let's look at the distribution of another variable, favoriteFruit, in the data too:
user_info.groupby('favoriteFruit')['_id'].count()
Figure 1.54: Seeing the distribution in use_info
We are now sufficiently prepared to handle any sort of problem we might face when trying to structure even unstructured data into a structured format. Let's do that in the activity here.
Activity 1: Addressing Data Spilling
We will now solve the problem that we encountered in Exercise 1. We start by loading sales.xlsx, which contains some historical sales data, recorded in MS Excel, about different customer purchases in stores in the past few years. Your current team is only interested in the following product types: Climbing Accessories, Cooking Gear, First Aid, Golf Accessories, Insect Repellents, and Sleeping Bags. You need to read the files into pandas DataFrames and prepare the output so that it can be added into your analytics pipeline. Follow the steps given here:
Open the Python console and import pandas and the copy module.
Load the data from sales.xlsx into a separate DataFrame, named sales, and look at the first few rows of the generated DataFrame. You will get the following output:

Figure 1.55: Output of the head function on sales.xlsx
Analyze the datatype of the fields and get hold of prepared values.
Get the column names right. In this case, every new column starts with a capital case.
Look at the first column, if the value in the column matches the expected values, just correct the column name and move on to the next column.
Take the first column with values leaking into other columns and look at the distribution of its values. Add the values from the next column and go on to as many columns as required to get to the right values for that column.
Slice out the portion of the DataFrame that has the largest number of columns required to cover the value for the right column and structure the values for that column correctly in a new column with the right attribute name.
You can now drop all the columns from the slice that are no longer required once the field has the right values and move on to the next column.
Repeat 4–7 multiple times, until you have gotten a slice of the DataFrame completely structured with all the values correct and pointing to the intended column. Save this DataFrame slice. Your final structured DataFrame should appear as follows:

Figure 1.56: First few rows of the structured DataFrame
Note
The solution for this activity can be found on page 316.


