Debugging your Flow
In Chapter 3, Manipulating Records in Visual Workflow, we had discussed a way to display a meaningful error message to the users when an unhandled exception occurred at runtime. But apart from displaying the custom error message to users, it's also important to understand various ways through which you can debug the Flow.
Onscreen debugging
There are various ways through which you can debug the Flow on the screen, which are as follows:
Inbuilt debugging tools
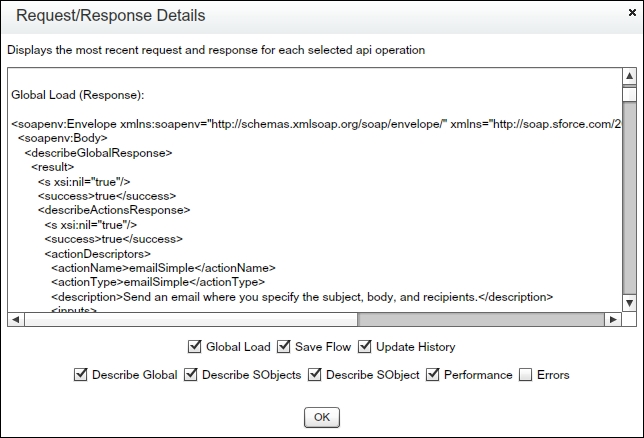
Visual Workflow has a prebuilt debugger tool that allows you to debug your Flow from the Flow canvas itself. To open debug window, press Ctrl + Shift + M (Windows), or command + shift + M (Mac), while you open the Flow canvas. It will look like the following screenshot:

Using debug screens
Another way to debug the Flow is to keep a debug screen after each of the Flow elements (for example, after Record Lookup, Record Create, Record Delete, Record Update, Assignment, or Decision) while developing it. It will help you to...


