Search icon CANCEL
Subscription
0
Cart icon
Your Cart (0 item)
Close icon
You have no products in your basket yet
Save more on your purchases! discount-offer-chevron-icon
Savings automatically calculated. No voucher code required.
Arrow left icon
Explore Products
Best Sellers
New Releases
Books
Videos
Audiobooks
Learning Hub
Newsletter Hub
Free Learning
Arrow right icon
timer SALE ENDS IN
0 Days
:
00 Hours
:
00 Minutes
:
00 Seconds
Arrow up icon
GO TO TOP
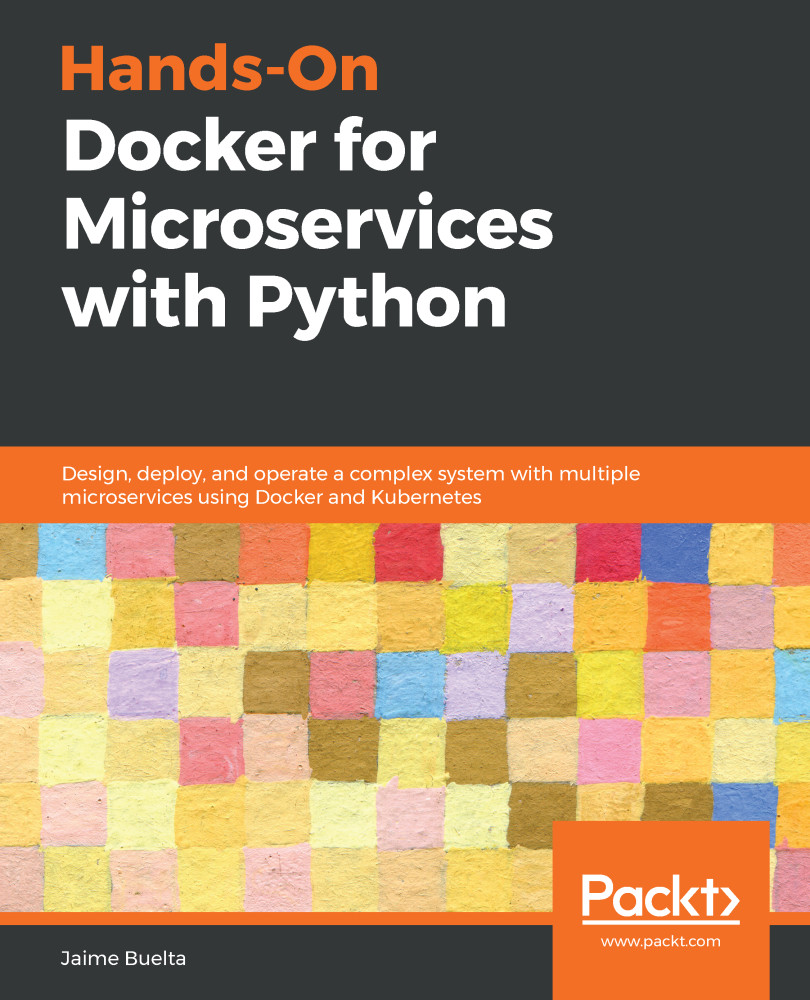
Hands-On Docker for Microservices with Python

You're reading from   Hands-On Docker for Microservices with Python Design, deploy, and operate a complex system with multiple microservices using Docker and Kubernetes

Arrow left icon
Product type Paperback
Published in Nov 2019
Publisher Packt
ISBN-13 9781838823818
Length 408 pages
Edition 1st Edition
Languages
Tools
Concepts
Arrow right icon
Author (1):
Arrow left icon
Jaime Buelta Jaime Buelta
Author Profile Icon Jaime Buelta
Jaime Buelta
Arrow right icon
View More author details
Toc

Table of Contents (19) Chapters Close

Preface 1. Section 1: Introduction to Microservices FREE CHAPTER
2. Making the Move – Design, Plan, and Execute 3. Section 2: Designing and Operating a Single Service – Creating a Docker Container
4. Creating a REST Service with Python 5. Build, Run, and Test Your Service Using Docker 6. Creating a Pipeline and Workflow 7. Section 3:Working with Multiple Services – Operating the System through Kubernetes
8. Using Kubernetes to Coordinate Microservices 9. Local Development with Kubernetes 10. Configuring and Securing the Production System 11. Using GitOps Principles 12. Managing Workflows 13. Section 4: Production-Ready System – Making It Work in Real-Life Environments
14. Monitoring Logs and Metrics 15. Handling Change, Dependencies, and Secrets in the System 16. Collaborating and Communicating across Teams 17. Assessments 18. Other Books You May Enjoy

Chapter 10

  1. What is the observability of a system?

It's the capacity of a system. It lets you know what its internal state is.

  1. What are the different severity levels that are available in logs by default?

In order of increasing severity, the different severity levels are DEBUG, INFO, WARNING, ERROR, and CRITICAL.

  1. What are metrics used for?

Metrics allow you to find out the aggregated statuses of the events that are occurring on the system and allow you to understand the general state of the system.

  1. Why do you need to add a request ID to the logs?

You need to add a request ID to the logs so that you can group all of the logs that correspond to the same request.

  1. What kinds of metrics are available in Prometheus?

Counters, which count a particular event; gauges, which keep track of a value that can go either up or down; and histograms (or summaries), which track events...

lock icon The rest of the chapter is locked
Register for a free Packt account to unlock a world of extra content!
A free Packt account unlocks extra newsletters, articles, discounted offers, and much more. Start advancing your knowledge today.
Unlock this book and the full library FREE for 7 days
Get unlimited access to 7000+ expert-authored eBooks and videos courses covering every tech area you can think of
Renews at $19.99/month. Cancel anytime
Banner background image