Plotting Scatter Plots
A scatter plot is a two‐dimensional chart that uses dots (or other shapes) to represent the values for two different variables. Scatter plots are often used to show how much the value of one variable is affected by another.
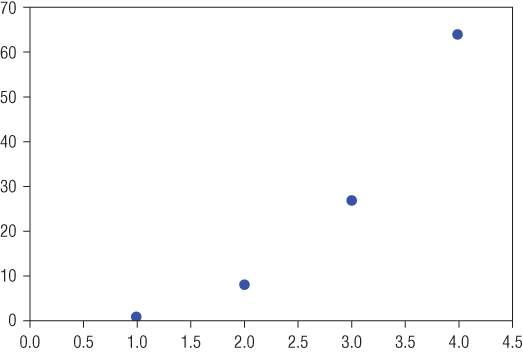
The following code snippet shows a scatter plot with the x‐axis containing a list of numbers from 1 to 4, and the y‐axis showing the cube of the x‐axis values:
%matplotlib inlineimport matplotlib.pyplot as pltplt.plot([1,2,3,4], # x-axis[1,8,27,64], # y-axis'bo') # blue circle markerplt.axis([0, 4.5, 0, 70]) # xmin, xmax, ymin, ymaxplt.show()
Figure 4.16 shows the scatter plot.

Figure 4.16: Plotting a scatter plot
Combining Plots
You can combine multiple scatter plots into one chart as follows:
%matplotlib inlineimport matplotlib.pyplot as pltimport numpy as npa = np.arange(1,4.5,0.1) # 1.0, 1.1, 1.2, 1.3…4.4plt.plot(a, a**2, 'y...


