The Web interface
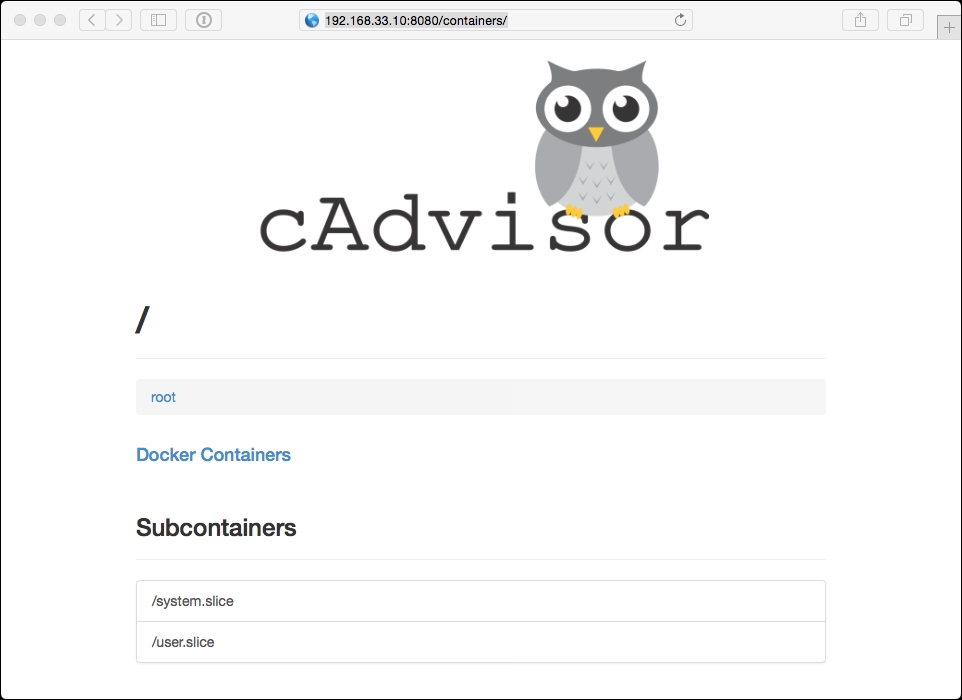
cAdvisor should be running on the 8080 port; if you open http://192.168.33.10:8080/, you should be greeted with the cAdvisor logo and an overview of your host machine:

This initial page streams live stats about the host machine, though each section is repeated when you start to drill down and view the containers. To start with, let's look at each section using the host information.
Overview
This overview section gives you a bird's-eye view of your system; it uses gauges so you can quickly get an idea of which resources are reaching their limits. In the following screenshot, there is very little in the way of CPU utilization and the file system usage is relatively low; however, we are using 64% of the available RAM:

Processes
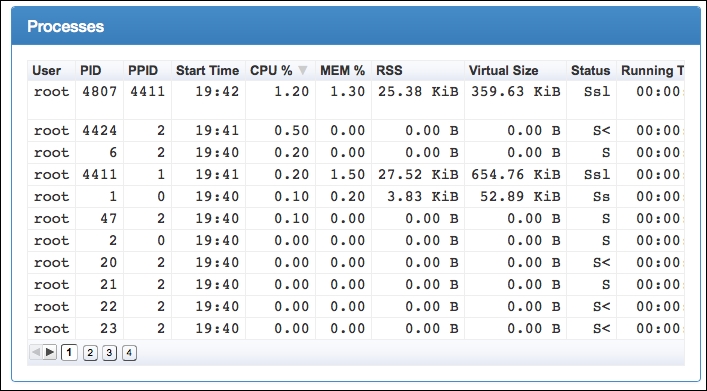
The following screenshot displays a combined view of the output of the ps aux, dockerps and top commands we used in the previous chapter:

Here is what each column heading means:
User: This shows which user is running the process
PID: This is the unique process...


