A word on GPU debugging
No matter how much experience you have in graphics programming, there will come a time when you need to debug an issue. Understanding exactly what the GPU is doing when it executes your program is not as immediate as on the CPU. Thankfully, GPU debugging tools have come a long way to help us when our program doesn’t behave as expected.
GPU vendors provide great tools to debug and profile your shaders: Nvidia has developed Nsight graphics, and AMD has a suite of tools that includes the Radeon GPU analyzer and Radeon GPU profiler.
For this book, we have primarily used RenderDoc (available at https://renderdoc.org/). It is a staple tool of the graphics programming community as it allows you to capture a frame and record all the Vulkan API calls that have been issued during that frame.
Using RenderDoc is really simple. You start by providing the path to your application, as follows:

Figure 1.2 – Setting the application path in RenderDoc
You then start the application by clicking Launch, and you will notice an overlay reporting the frame time and the number of frames rendered. If you press F12, RenderDoc will record the current frame. You can now close your application, and the recorded frame will automatically load.
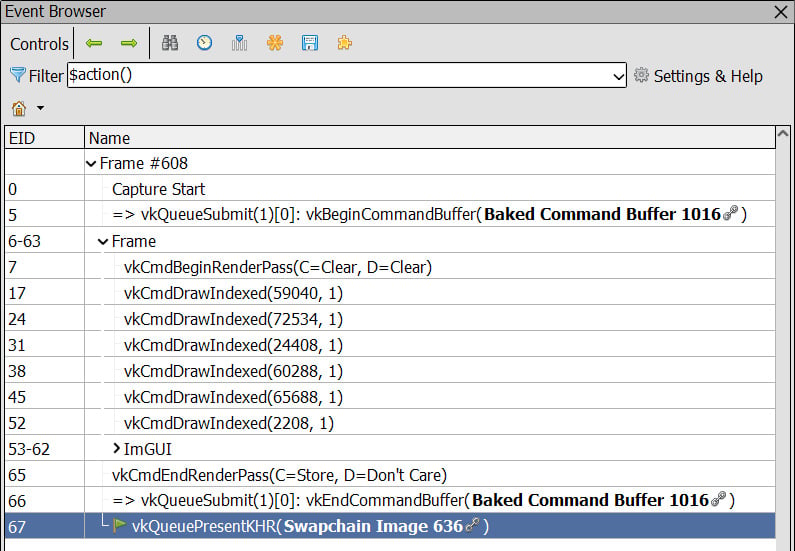
On the left, you have the list of API calls grouped in render passes. This view also lists the event ID (EID), which is a progressive number defined by RenderDoc. This is useful for comparing events across multiple frames:

Figure 1.3 – The list of Vulkan API calls for the captured frame
On the right side of the application window, you have multiple tabs that allow you to inspect which textures are bound when a draw call is made, the buffer content, and the state of the pipeline.
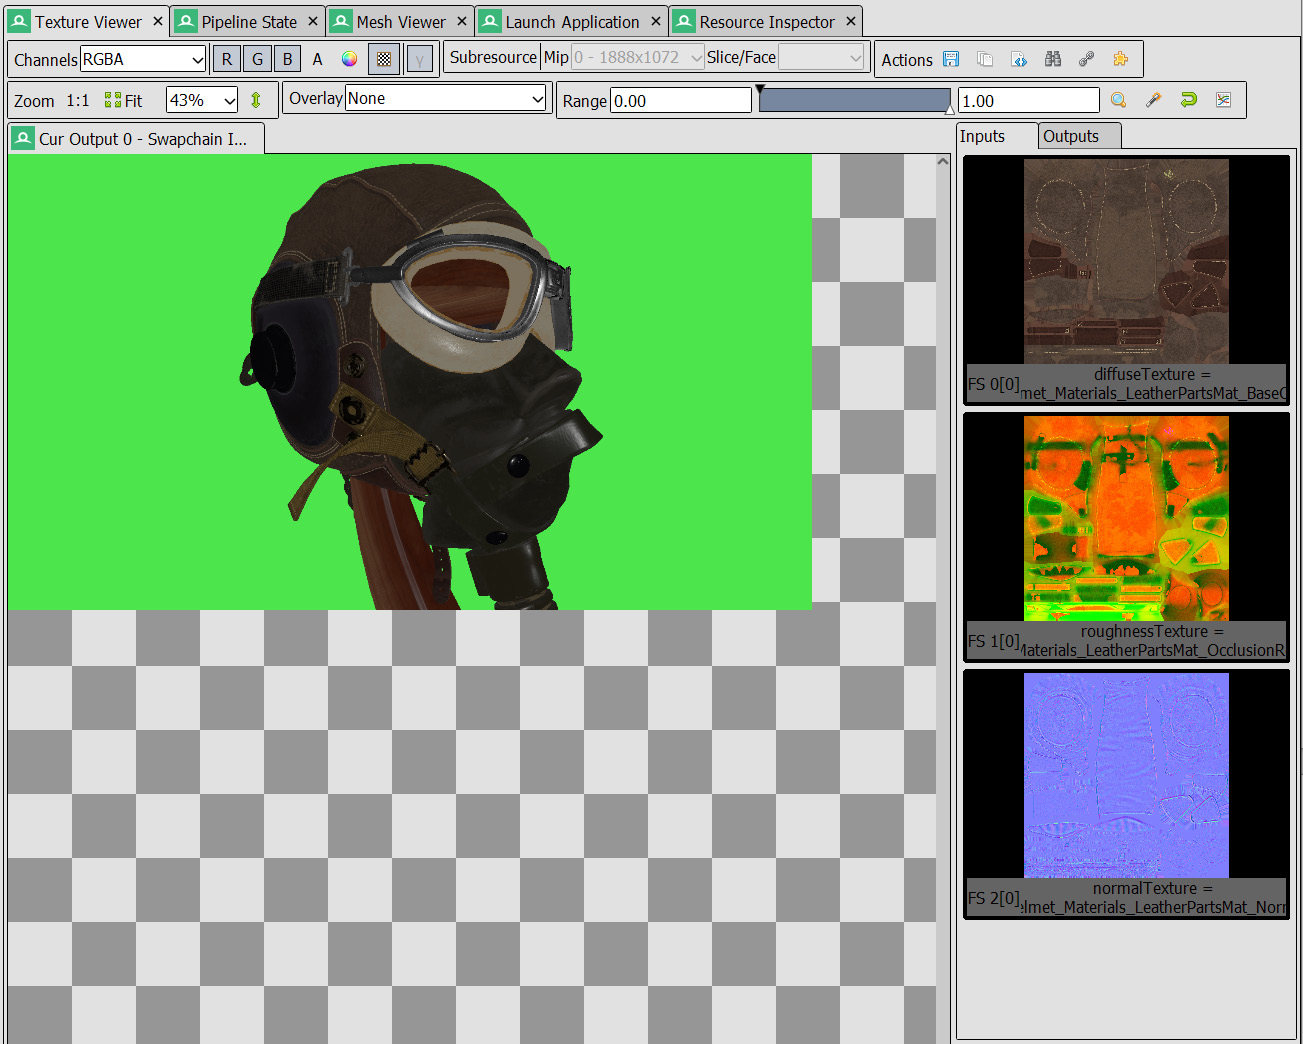
The following figure shows the Texture Viewer tab. It shows the rendering output after a given draw and which input textures were bound:

Figure 1.4 – RenderDoc texture viewer
If you right-click on a pixel in the Texture Viewer tab, you can inspect the history of that pixel to understand which draws affected it.
There is also a debug feature that allows you to step through the shader code and analyze intermediate values. Be careful when using this feature, as we have noticed that the values are not always accurate.
This was a quick overview of RenderDoc and its functionality. You have learned how to capture a frame in RenderDoc when running a graphics application. We presented a breakdown of the main panels, their functionality, and how to use them to understand how the final image is rendered.
We encourage you to run the code from this chapter under RenderDoc to better understand how the frame is built.


