Search icon CANCEL
Arrow left icon
Explore Products
Best Sellers
New Releases
Books
Videos
Audiobooks
Learning Hub
Conferences
Free Learning
Arrow right icon
Arrow up icon
GO TO TOP
Web Development with Blazor

You're reading from   Web Development with Blazor A hands-on guide for .NET developers to build interactive UIs with C#

Arrow left icon
Product type Paperback
Published in Jun 2021
Publisher Packt
ISBN-13 9781800208728
Length 310 pages
Edition 1st Edition
Languages
Tools
Arrow right icon
Author (1):
Arrow left icon
Jimmy Engström Jimmy Engström
Author Profile Icon Jimmy Engström
Jimmy Engström
Arrow right icon
View More author details
Toc

Table of Contents (20) Chapters Close

Preface 1. Section 1:The Basics
2. Chapter 1: Hello Blazor FREE CHAPTER 3. Chapter 2: Creating Your First Blazor App 4. Section 2:Building an Application with Blazor
5. Chapter 3: Introducing Entity Framework Core 6. Chapter 4: Understanding Basic Blazor Components 7. Chapter 5: Creating Advanced Blazor Components 8. Chapter 6: Building Forms with Validation 9. Chapter 7: Creating an API 10. Chapter 8: Authentication and Authorization 11. Chapter 9: Sharing Code and Resources 12. Chapter 10: JavaScript Interop 13. Chapter 11: Managing State 14. Section 3:Debug, Test, and Deploy
15. Chapter 12: Debugging 16. Chapter 13: Testing 17. Chapter 14: Deploy to Production 18. Chapter 15: Where to Go from Here 19. Other Books You May Enjoy

Debugging Blazor WebAssembly in the web browser

The first debugging experience for Blazor WebAssembly was the ability to debug right in the web browser:

  1. In Visual Studio, start the project by pressing Ctrl + F5 (run without debugging).
  2. In the web browser, press Shift + Alt + D.

    We will get an error message with instructions on how to start the web browser in debug mode.

    I am running Edge, so the way to start Edge would be something like this:

    msedge --remote-debugging-port=9222 --user-data-dir="C:\Users\Jimmy\AppData\Local\Temp\blazor-edge-debug" --no-first-run https://localhost:5001/

    Copy the command.

  3. Press Win + R and paste the command.
  4. A new instance of Chrome or Edge will open. In this new instance, press Shift + Alt + D.
  5. We should now see a source tab containing C# code from our project. From here, we can put breakpoints that will be hit, and we can hover over variables.

The debug UI can be seen in Figure 12.4:
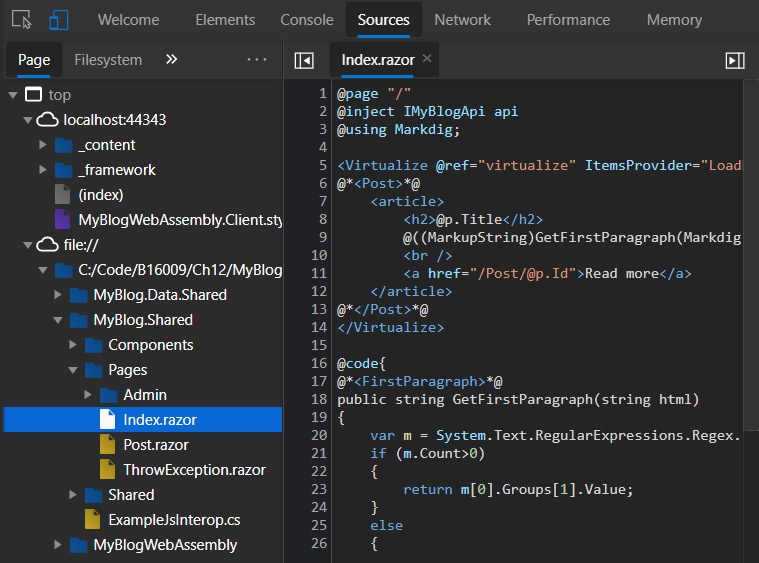
Figure 12.4 – Screenshot of the in-browser debug

Figure...

lock icon The rest of the chapter is locked
Register for a free Packt account to unlock a world of extra content!
A free Packt account unlocks extra newsletters, articles, discounted offers, and much more. Start advancing your knowledge today.
Unlock this book and the full library FREE for 7 days
Get unlimited access to 7000+ expert-authored eBooks and videos courses covering every tech area you can think of
Renews at $19.99/month. Cancel anytime