GUI elements and customization
When you first start QGIS, you will see the interface, as shown on the following screenshot. By definition, the QGIS interface uses the system language. For the purpose of this tutorial, you can change it in English by going to Settings | Options | Locale and restarting QGIS to apply your changes.

The QGIS interface consists of five main sections:
- Menu bar: This provides access to all QGIS functions in the conventional form—drop-down menus.
- Panels: These are windows that can be either docked or floating. By default, you can see two panels activated on the left side of the workspace.
- The Layers panel is designated to display a tree view list of all loaded layers.
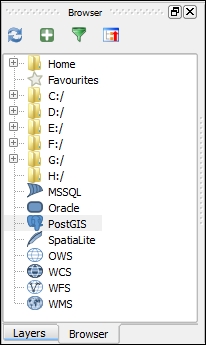
- The Browser panel provides quick navigation and access to the various local, server, or online data sources. You can close or shrink a panel using special buttons in its top-right corner. You can also drag and drop it to a place handily.
Tip
Throughout this book, we will use the Browser panel from time to time, so try to assign it a proper position instead of closing it. For example, by dragging and dropping it onto the Layers panel, you can create two independent tabs: one for layers and the other for data source navigation. In this case, you will not have to sacrifice window the space necessary for expanding and viewing items.

Panels can be turned on or off by going to View | Panels. Similarly, you can right-click anywhere on the upper bar of the workspace, and a window with toggles will pop up. This window is divided by a horizontal line and the panels toggles are located in its upper part.
- Toolbars: Menu functions are grouped into logical toolsets and placed as buttons in bars to provide handy access to all the necessary tools. By default, the following toolbars are turned on and displayed:

File toolbar

Map Navigation toolbar

Attributes toolbar

Digitizing toolbar

Label toolbar

Help and Plugins toolbars

Manage Layers toolbar
If you want to see a short tool reference, just hover your mouse pointer over the button and a yellow information window will pop up. Some buttons or toolbars are grayed out (for example, the Digitizing toolbar and Label toolbar), which means that they can be used only after some actions have been performed. For example, the Digitizing toolbar's buttons become available only after editing mode is activated for some layers. Toolbars are dockable and can easily be moved around the workspace. To move a toolbar, place the mouse arrow over its border marked by perforation dots. The arrow will turn into a cross, symbolizing that the toolbar can now be dragged and dropped to any other place while holding down the left button of the mouse. You can turn the toolbars on or off by navigating to View | Toolbars, or from the window called by a right click on any toolbar.
- Map area: This is the largest section of the interface window, and is designed for data map display and visual exploration.
- Status bar: This briefly displays the following information about your current map overview: a progress bar of the rendering (visible only if rendering takes some time to show its progress), the mouse pointer's position coordinates, the scale, and the current coordinate reference system. It also contains toggles for switching from point position coordinates to extent, and temporarily turning off map rendering. There are also buttons used to open the coordinate reference system dialog
 and show the Log Message panel
  .
.
Advanced GUI customization is possible by navigating to Settings | Customization. From this dialog, you can get complete control over all menus, panels, bars, and widgets. To start the process of customization, turn on the Enable customization toggle. As long as you are not familiar with QGIS interface, it will be easier to enter  Switch to catching widgets in main application mode. In this mode, you can click on any GUI item you want to hide—a button on a toolbar or a toolbar itself. The chosen items are highlighted and the relevant customization tree item is expanded, as shown in the following screenshot. If you have chosen an item by mistake, simply click on it once again to unselect. Otherwise, you can expand the relevant item, check/uncheck some toggles, and click on OK. The changes are applied after QGIS restarts.

Tip
As your familiarity with QGIS grows and you start using it for different tasks, it might be convenient to create a few users' GUI profiles, aimed at different use cases (for example, digitizing, working with databases or raster data, and so on). To do so, you need to adjust all the necessary settings in the Customization dialog window, and save  them in a
 .ini file. After that, you will be able to quickly modify the interface just by loading settings  from a predefined customization file.
Some minor interface changes, such as general style, default icon size, font and more, are available from the Application group, which can be found by going to Settings | Options | General.


