If you have ever developed code in a popular development environment, such as Microsoft Visual Studio, IntelliJ IDEA, Eclipse, or other similar IDEs, your first experience with the NAV debugger may seem unusual. Usually, a debugger starts within the same interface as the code editor and attaches to the application thread started from the same environment. In Dynamics NAV, the debugger is activated in two steps. First, start the session list in the code editor (choose the menu action Tools | Debugger | Debug Session). This action opens a window with a list of NAV client sessions currently running on the same computer. To start the debugger, choose the session you want to debug from the list and press Debug.
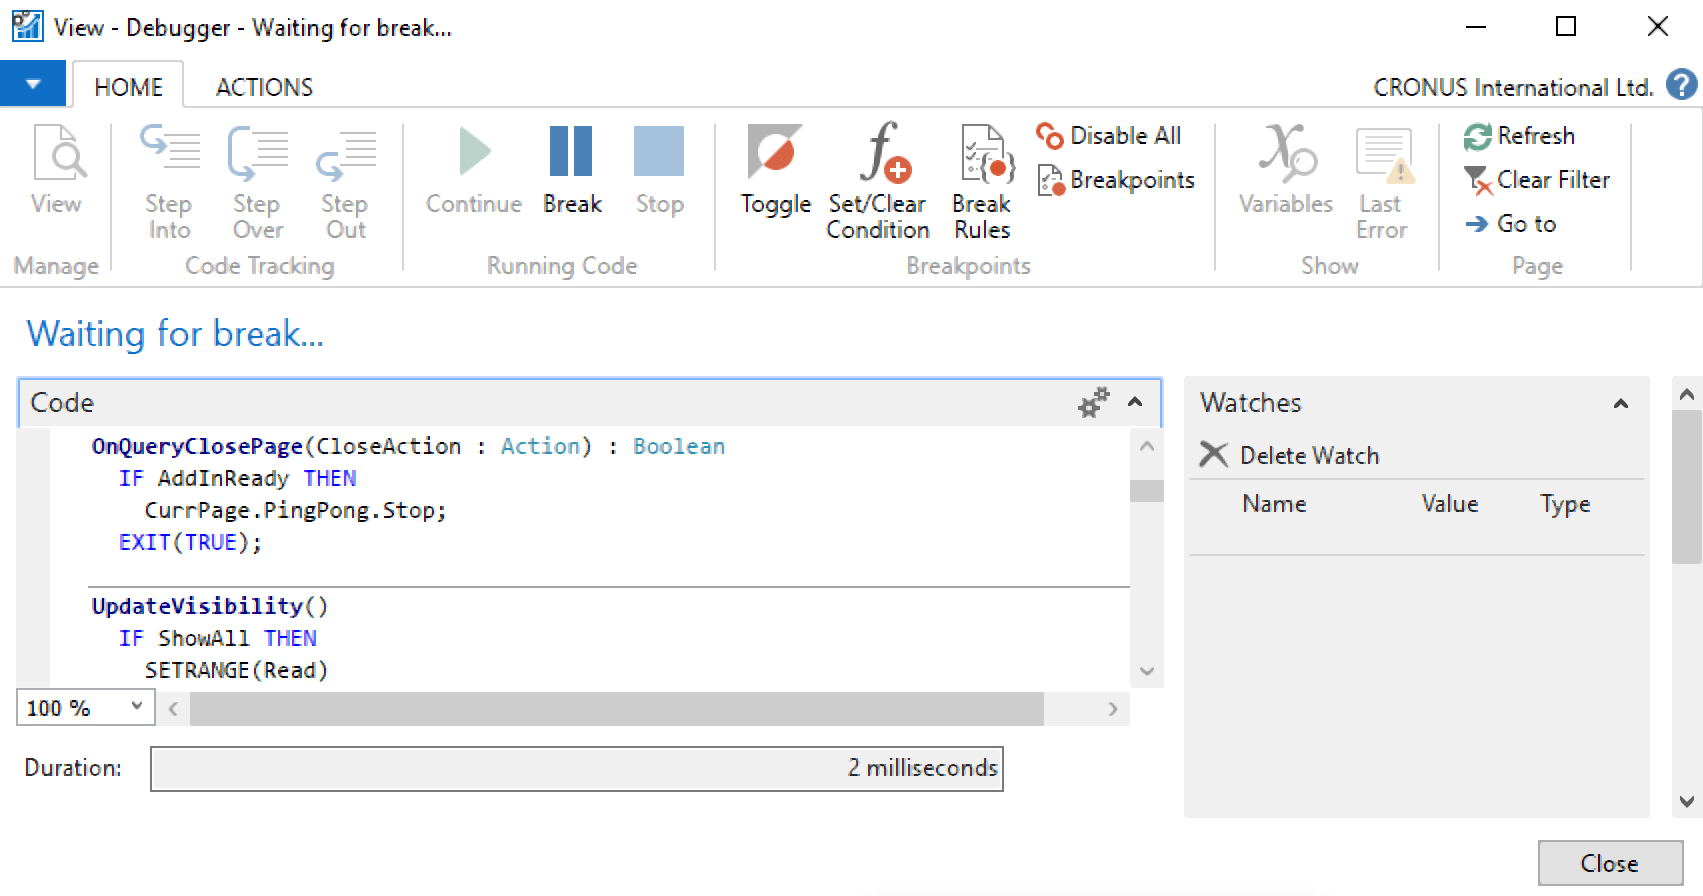
The next screenshot illustrates the debugger window:
If there are no running sessions, this button will be inactive. You can press...


