Finding faults
No one likes faults, but this is where we should start the chapter.
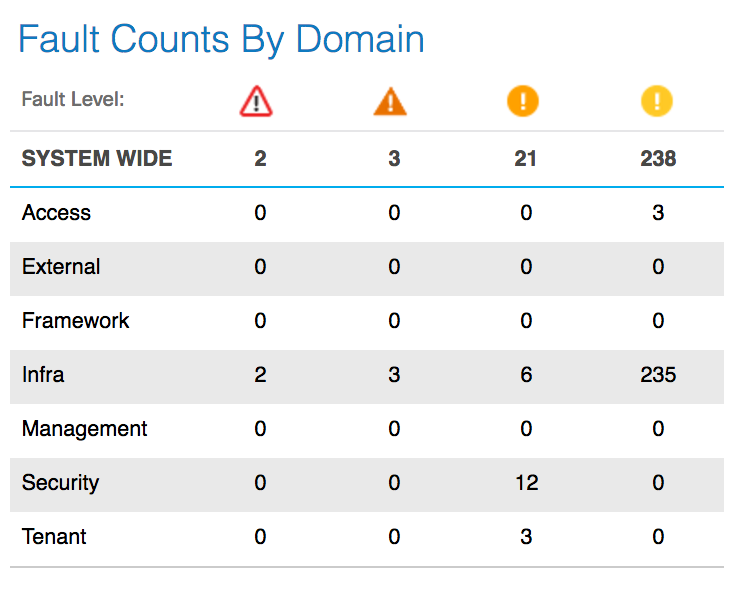
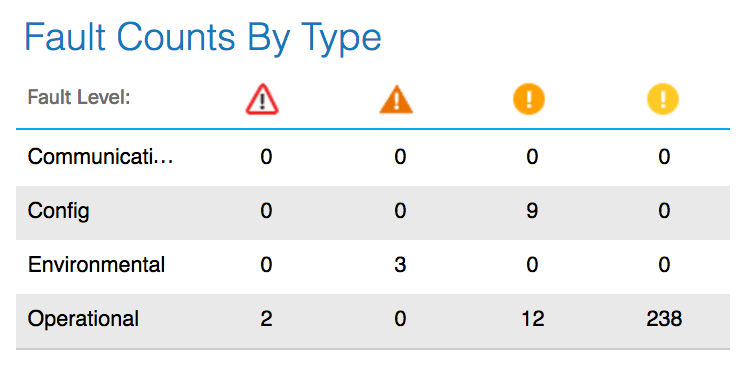
Looking at the dashboard, we can see that there are a number of faults in the system. These are separated into counts by domain and by type.
Fault Counts By Domain will list the sum of faults by severity, from critical to informational at the top and, underneath that, by the individual domain:

Fault Counts By Type shows the faults of the communications, configuration, environmental, and operational types.

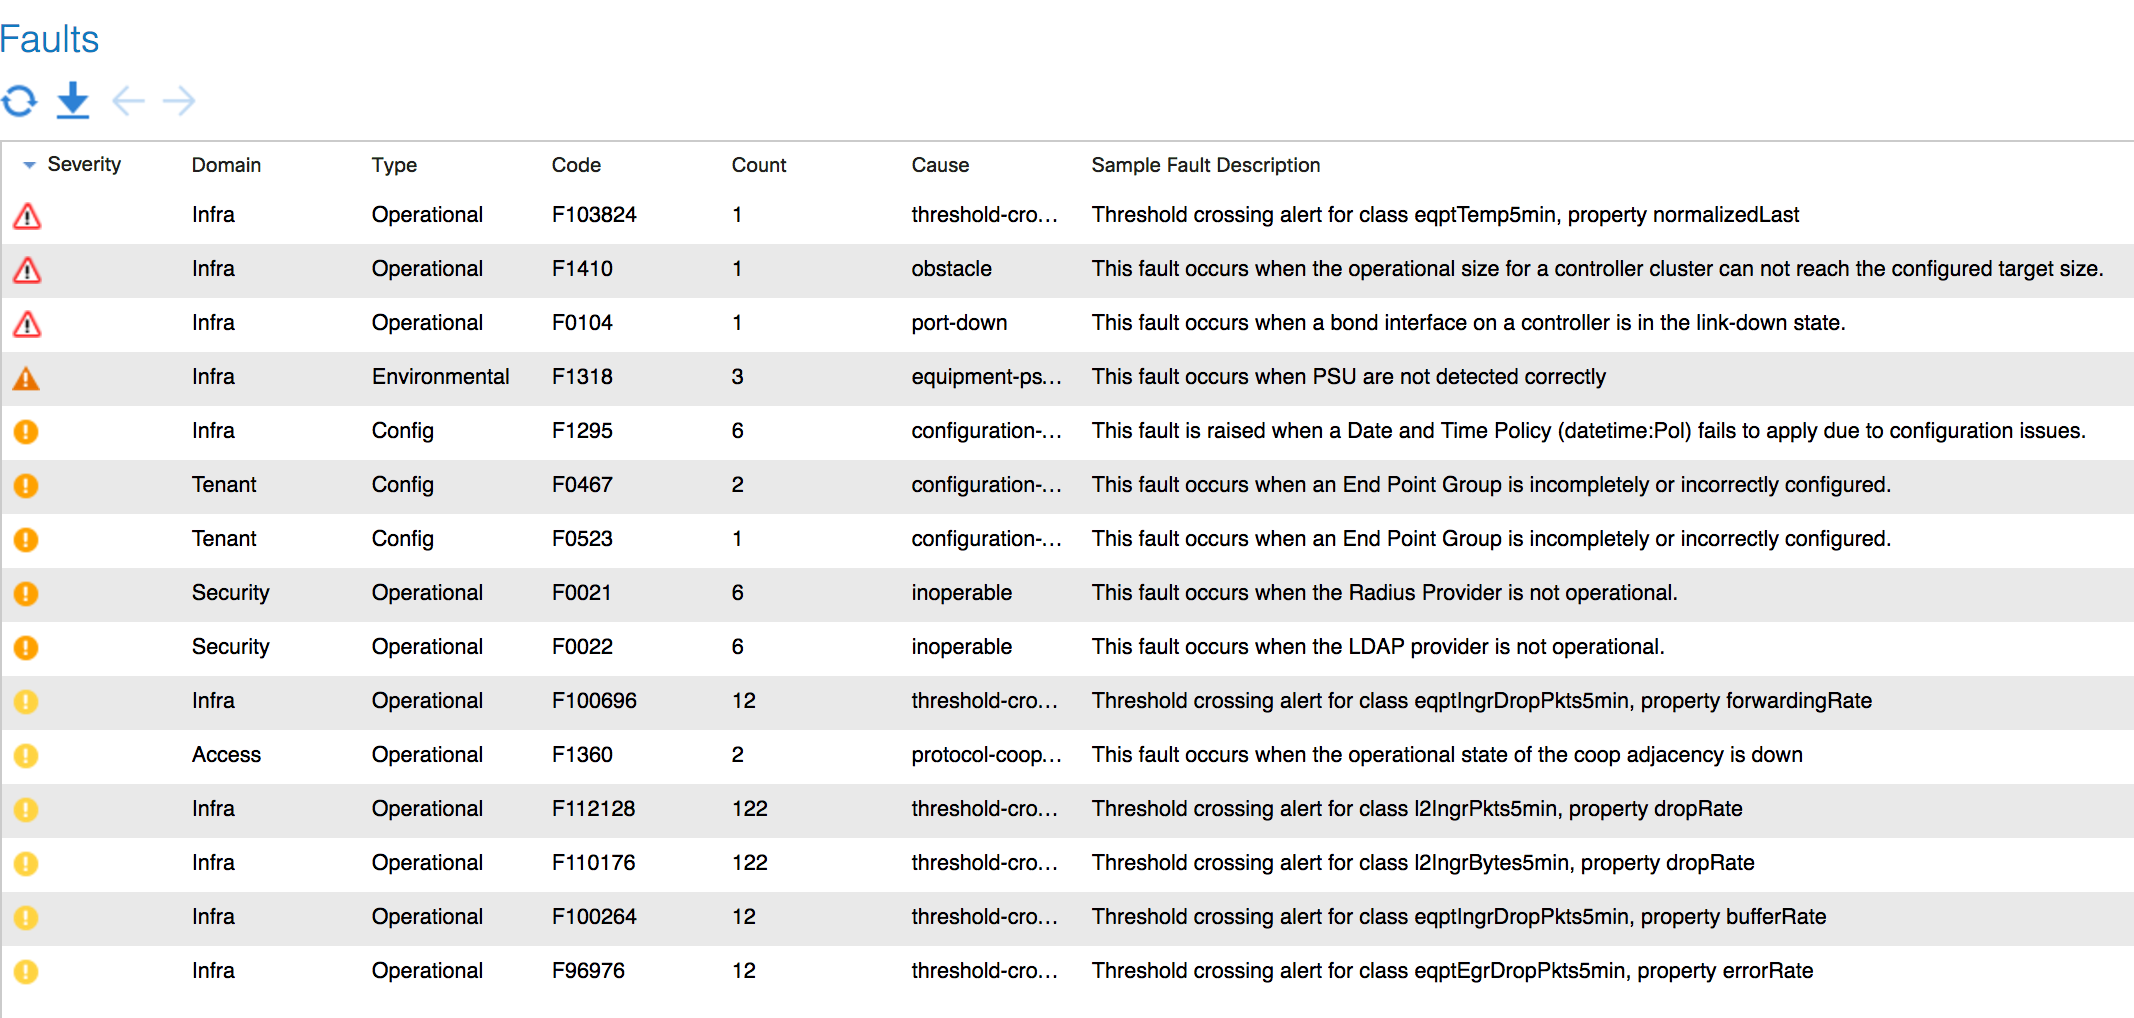
Looking at these screenshots, we have a number of faults. Let's find out what they are.
How to do it...
- Navigate to
System|Faults.

- The listed faults (which are samples in this instance) are listed in order of severity. Double-clicking on one of them will open a fault detail page:

- Faults will display a severity on the left-hand side. If the icon is a green circle with a tick in it, then the fault has cleared. We can acknowledge the fault by ticking the checkbox.
- Double-clicking on the fault will open another window...


