Search icon CANCEL
Subscription
0
Cart icon
Your Cart (0 item)
Close icon
You have no products in your basket yet
Save more on your purchases! discount-offer-chevron-icon
Savings automatically calculated. No voucher code required.
Arrow left icon
Explore Products
Best Sellers
New Releases
Books
Videos
Audiobooks
Learning Hub
Newsletter Hub
Free Learning
Arrow right icon
timer SALE ENDS IN
0 Days
:
00 Hours
:
00 Minutes
:
00 Seconds
Arrow up icon
GO TO TOP
Microsoft Dynamics NAV 2009: Professional Reporting

You're reading from   Microsoft Dynamics NAV 2009: Professional Reporting Discover all the tips and tricks for Dynamics NAV report building

Arrow left icon
Product type Paperback
Published in Oct 2011
Publisher Packt
ISBN-13 9781849682442
Length 352 pages
Edition 1st Edition
Languages
Arrow right icon
Author (1):
Arrow left icon
Steven Renders Steven Renders
Author Profile Icon Steven Renders
Steven Renders
Arrow right icon
View More author details
Toc

Table of Contents (15) Chapters Close

Microsoft Dynamics NAV 2009: Professional Reporting
Credits
About the Author
Acknowledgement
About the Reviewers
www.PacktPub.com
Preface
1. Charts and Dimensions FREE CHAPTER 2. Creating a Report in the Classic Client 3. Creating Role Tailored Reports 4. Visualization Methods 5. Developing Specific Reports 6. Other Reporting and Business Intelligence Tools 7. A View of the Future Index

Creating an Excel-like layout for a report


This is how the sections look like when you take the Work Order report into design mode:
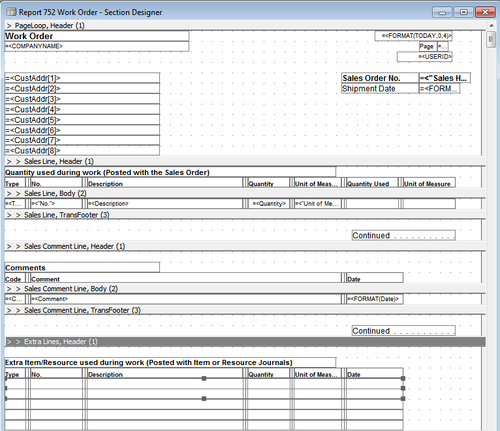
When you look a little closer and click on one of the cells, you will notice that when you have a look at its properties, they are the properties of a Shape control. When you select a Shape control in the toolbox and put it on a section you can decide via the property ShapeStyle which type of Shape you are adding.

These are the possible values for the ShapeStyle property of a Shape control:

  • Rectangle

  • Rounded Rectangle

  • Oval

  • Triangle

  • NWLine

  • NELine

  • HorzLine

  • VertLine

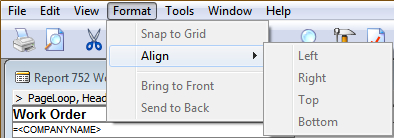
You have to put the Shape control on top of the other controls (labels, textboxes) that contain the actual data. To do this you can select a Shape and bring it to front or send it to back using the Format menu on top of the report designer like this:
Tip

Overlapping controls

As you can see, putting two controls on top of each other can provide an added value. Another example of when this technique is applied is...

lock icon The rest of the chapter is locked
Register for a free Packt account to unlock a world of extra content!
A free Packt account unlocks extra newsletters, articles, discounted offers, and much more. Start advancing your knowledge today.
Unlock this book and the full library FREE for 7 days
Get unlimited access to 7000+ expert-authored eBooks and videos courses covering every tech area you can think of
Renews at $19.99/month. Cancel anytime
Banner background image