Search icon CANCEL
Subscription
0
Cart icon
Close icon
You have no products in your basket yet
Save more on your purchases!
Savings automatically calculated. No voucher code required
Arrow left icon
All Products
Best Sellers
New Releases
Books
Videos
Audiobooks
Learning Hub
Newsletters
Free Learning
Arrow right icon
Learning Tableau

You're reading from  Learning Tableau

Product type Book
Published in Apr 2015
Publisher Packt
ISBN-13 9781784391164
Pages 340 pages
Edition 1st Edition
Languages
Author (1):
Joshua N. Milligan Joshua N. Milligan
Profile icon Joshua N. Milligan

Table of Contents (18) Chapters

Learning Tableau
Credits
About the Author
About the Reviewers
www.PacktPub.com
Preface
1. Creating Your First Visualizations and Dashboard 2. Working with Data in Tableau 3. Moving from Foundational to Advanced Visualizations 4. Using Row-level and Aggregate Calculations 5. Table Calculations 6. Formatting a Visualization to Look Great and Work Well 7. Telling a Data Story with Dashboards 8. Adding Value to Analysis – Trends, Distributions, and Forecasting 9. Making Data Work for You 10. Advanced Techniques, Tips, and Tricks 11. Sharing Your Data Story Index

Quick table calculations


Quick table calculations are predefined table calculations that can be applied to any field used as a measure in the view. These calculations include common and useful calculations such as the running total, difference, percent difference, percent of total, rank, percentile, moving average, YTD total, compound growth rate, year over year growth, and YTD growth. These calculations do not show up as separate fields in the Data window.

Consider the following example using the sample Superstore Sales data:

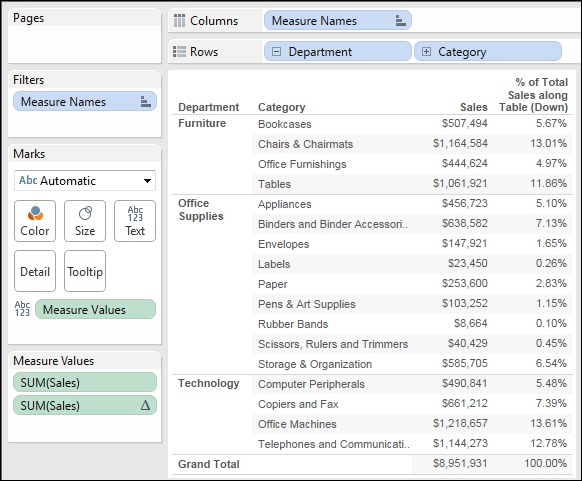
Here, Sales is shown twice using Measure Names and Measure Values. The second SUM(Sales) field has the Percent of Total quick table calculation applied. Each value shown in the Sales column is the sum of sales for that department and category. The value shown in the % of Total Sales column is the sum of sales for that department and category divided by the total sum of sales. Using the quick table calculation avoided writing any code.

Tip

You can actually see the code...

lock icon The rest of the chapter is locked
Register for a free Packt account to unlock a world of extra content!
A free Packt account unlocks extra newsletters, articles, discounted offers, and much more. Start advancing your knowledge today.
Unlock this book and the full library FREE for 7 days
Get unlimited access to 7000+ expert-authored eBooks and videos courses covering every tech area you can think of
Renews at $15.99/month. Cancel anytime}