
The model is ready for analysis. As with the analytics model, we once again need to create a temporary story to view the data of this model. Execute the following set of steps for this purpose:
- From the main menu, go to Create | Story.
- On the first wizard page that asks how you want to start the story, select the Add a Canvas page option. The story page will appear with a default name for the new story.
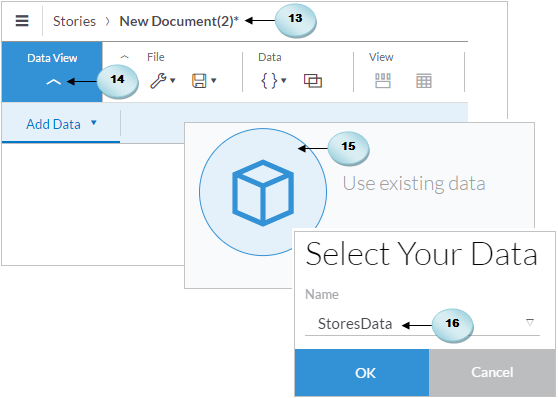
- Click on the arrow in the Data View section on the toolbar. You will be prompted to add data.
- On this screen, select Use existing data.
- In the Select Your Data dialog, select StoresData. This is the planning model data you uploaded in the previous section. Click on OK to dismiss the dialog:
The data view panels that you worked with in the previous chapter will be presented again. Click on Quantity sold (A) in the Measures pane to see its actual...