IT as a Service explained
Here's a scenario that might sound familiar, it's Friday afternoon (because these things always seem to happen before you clock off for the weekend), an end-user in your organization notifies you of an outage to an application and it's the first time you've heard of the incident.
Suddenly, you find yourself scrambling to find a solution to the application outage by trawling through the many e-mail alerts that your monitoring tool has kindly filled your inbox with and you're not even sure where to begin. Then your boss starts demanding to know when exactly everything will be back up and running again.
Finally, it's close to midnight and everyone's gone home except you. You've eliminated most of the noisy alerts in your inbox and narrowed the problem down to a bunch of alerts referring to network connectivity. Eventually, you find the network cable that the new junior admin earlier mistakenly disconnected from one of the many switches you manage in the datacenter! Once the cable is plugged back in, everything comes back online and you get to start your weekend.
This is a classic example of reactive monitoring—wherein, even though you had a monitoring tool in place, due to the constant stream of alerts you've been receiving, you missed the alert about the cable being disconnected and only reacted after the end-user logged an application outage incident. Even if you had picked up the network connectivity alert, there's still a good chance that you don't understand the overall impact of it on the business and it might not even be considered to be a valid reason for end-users complaining about their application outages.
What you really need in this situation is a monitoring solution that can bring all of the related components of an application together in the form of an IT service to help reduce your Mean Time to Resolution (MTTR), which translates to you resolving incidents quicker and keeping your end-users happy.
This is where OpsMgr comes in very useful. With OpsMgr, you can create comprehensive maps of your IT services based on your IT service catalog. With your IT services mapped out, you can then begin to understand all the components that make up each service.
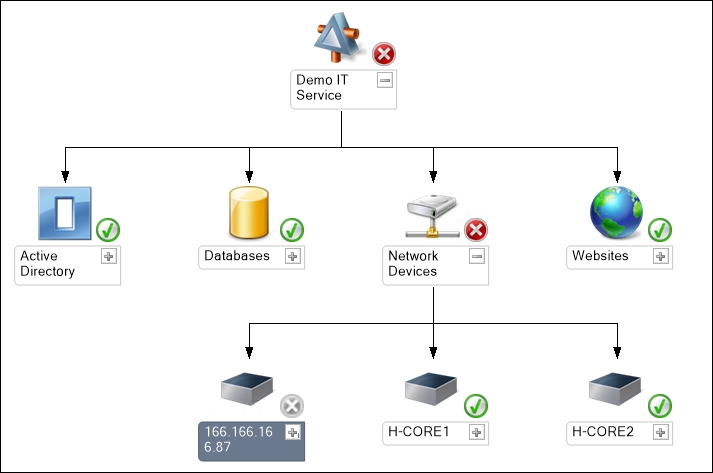
If we apply this strategy to our example scenario, the next time someone disconnects a network cable, red lights will start to appear on a dashboard monitoring the IT service. It then becomes very easy to quickly identify the root cause of the outage. In Figure 1.1, you can see an example of an IT service modeled in OpsMgr that has been affected by someone disconnecting a cable from a network device.

Figure 1.1: The Operations Console
Adopting a similar monitoring strategy will enable you to focus on the IT services that run your business from a holistic management perspective, instead of on an individual component-by-component basis. This model is defined as IT as a Service (ITaaS).
Note
Using ITaaS you can manage your services in the same way that your end-users consume them—essentially viewing each complex IT service as a single entity with a green, amber, or red health state, similar to a traffic light status!
As you progress through this book, you will learn more about how to use the ITaaS model. This will not only help you reduce the amount of time you spend trying to identify the root cause of problems, but it will facilitate you to move closer to delivering a proactive monitoring approach for all your IT services and one where you can catch possible incidents before they become bigger problems.


