Inspecting your system with Observer
The command line isn't the only way to get information on an Erlang VM. There is a GUI tool named Observer that allows access to information in a more convenient way.
If a GUI-enabled system is available, Observer allows us to open multiple windows with information on the whole system's statistics or even an individual process of that running system.
Getting ready
Start an IEx session.
How to do it…
To use the Observer GUI application, we will follow these steps:
- Start the Observer application:
iex(1)> :observer.start
:ok
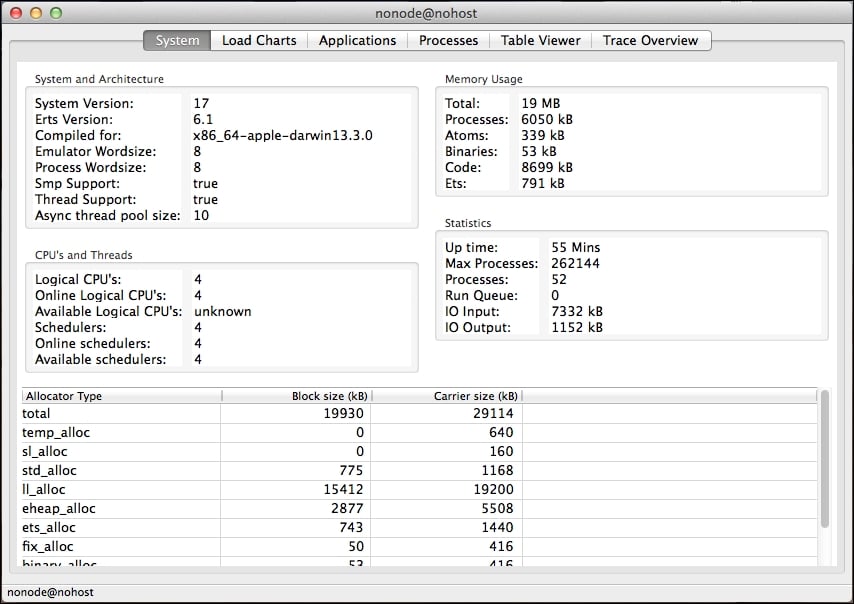
- A new window with a tabbed interface will open, and the first information displayed shows CPU information, memory usage, system information, and statistics, as shown in the following screenshot:

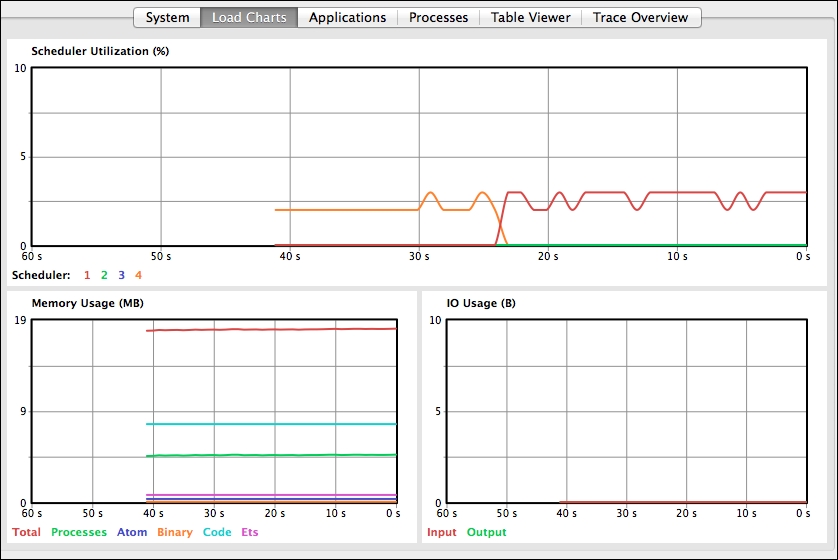
- Select the Load Charts tab to see graphical representation of memory usage, IO, and scheduler utilization over time, as shown here:

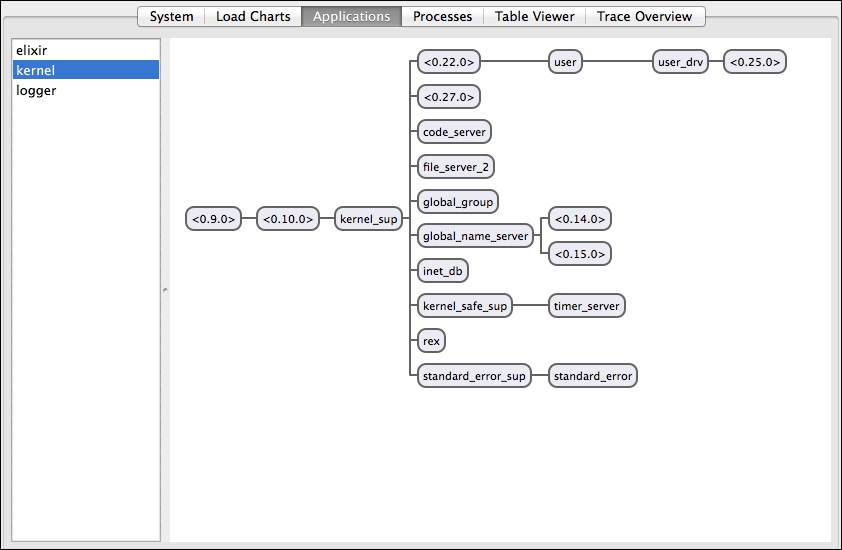
- Under the Applications tab, by selecting the kernel application, it is possible to see a representation of an application process's hierarchy, as shown in this screenshot:

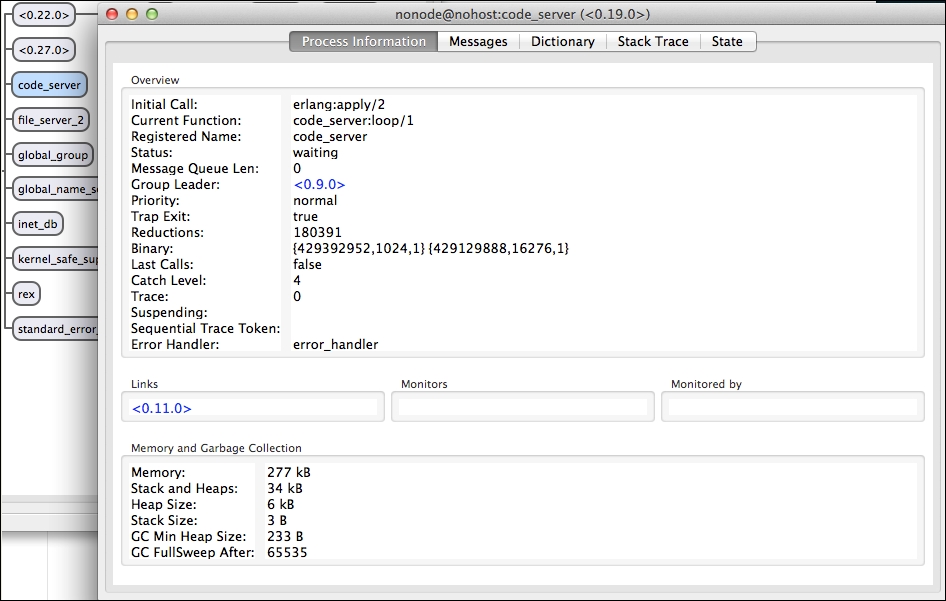
- Double-click on any of the nodes, for example,
code_server. A new window will be opened with information for the specific process, as shown in the following screenshot:


