Search icon CANCEL
Subscription
0
Cart icon
Your Cart (0 item)
Close icon
You have no products in your basket yet
Arrow left icon
Explore Products
Best Sellers
New Releases
Books
Videos
Audiobooks
Learning Hub
Newsletter Hub
Free Learning
Arrow right icon
timer SALE ENDS IN
0 Days
:
00 Hours
:
00 Minutes
:
00 Seconds
Arrow up icon
GO TO TOP
Tableau 2019.x Cookbook

You're reading from   Tableau 2019.x Cookbook Over 115 recipes to build end-to-end analytical solutions using Tableau

Arrow left icon
Product type Paperback
Published in Jan 2019
Publisher Packt
ISBN-13 9781789533385
Length 670 pages
Edition 1st Edition
Languages
Tools
Arrow right icon
Authors (6):
Arrow left icon
Tania Lincoln Tania Lincoln
Author Profile Icon Tania Lincoln
Tania Lincoln
Slaven Bogdanovic Slaven Bogdanovic
Author Profile Icon Slaven Bogdanovic
Slaven Bogdanovic
Teodora Matic Teodora Matic
Author Profile Icon Teodora Matic
Teodora Matic
Rintaro Sugimura Rintaro Sugimura
Author Profile Icon Rintaro Sugimura
Rintaro Sugimura
Dmitry Anoshin Dmitry Anoshin
Author Profile Icon Dmitry Anoshin
Dmitry Anoshin
Dmitrii Shirokov Dmitrii Shirokov
Author Profile Icon Dmitrii Shirokov
Dmitrii Shirokov
+2 more Show less
Arrow right icon
View More author details
Toc

Table of Contents (18) Chapters Close

Preface 1. Getting Started with Tableau Software FREE CHAPTER 2. Data Manipulation 3. Tableau Extracts 4. Tableau Desktop Advanced Calculations 5. Tableau Desktop Advanced Filtering 6. Building Dashboards 7. Telling a Story with Tableau 8. Tableau Visualization 9. Tableau Advanced Visualization 10. Tableau for Big Data 11. Forecasting with Tableau 12. Advanced Analytics with Tableau 13. Deploy Tableau Server 14. Tableau Troubleshooting 15. Preparing Data for Analysis with Tableau Prep 16. ETL Best Practices for Tableau 17. Other Books You May Enjoy

Building a tree map

Tree maps are useful for showing relative proportions of many categories in a total. In this recipe, we will investigate the composition of our dataset to see which states are dominant, with the most records, and which are represented with fewer records.

Getting ready

Connect to the Baby_names.csv data source and open a new worksheet.

How to do it...

  1. Drag and drop Number of Records from Measures onto Size in the Marks card.
  2. Drag and drop State from Dimensions onto Detail in the Marks card.
  3. Drag and drop State from Dimensions onto Label in the Marks card.
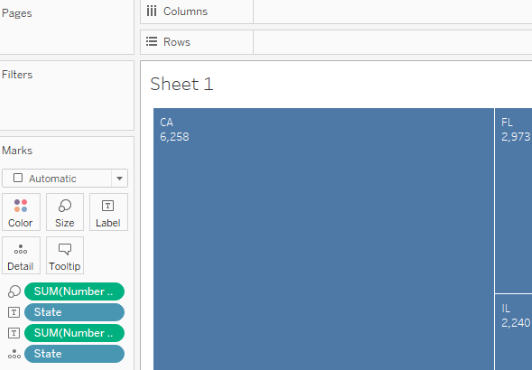
  1. Drag and drop Number of Records from Measures onto Label in the Marks card:
How it works...

The number of records is an automatically generated measure that simply represents the number of rows in the dataset. We are using it to see the relative representation of each state in our dataset.

There's more...

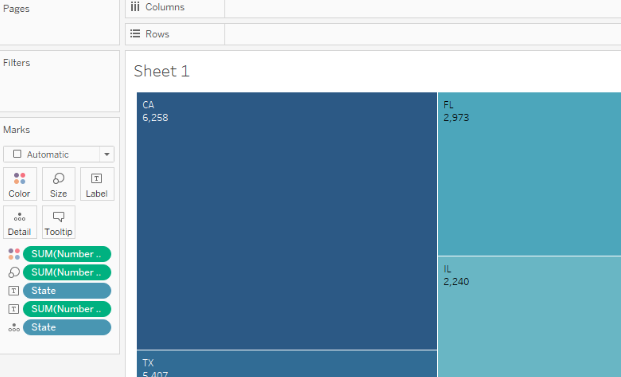
Placing a measure, in this case, Number of Records, on Size is necessary for creating a tree map. However, you can make your tree map even more intuitive by adding Number of Records to Color as well. You just need to drag and drop Number of Records from Measures onto Color in the Marks card button, and the value of Number of Records will also be reflected by a color gradient of the rectangles. You can also change and adjust the color palette by clicking on the Color button in the Marks card and choosing the settings you prefer:
See also

You have been reading a chapter from
Tableau 2019.x Cookbook
Published in: Jan 2019
Publisher: Packt
ISBN-13: 9781789533385
Register for a free Packt account to unlock a world of extra content!
A free Packt account unlocks extra newsletters, articles, discounted offers, and much more. Start advancing your knowledge today.
Unlock this book and the full library FREE for 7 days
Get unlimited access to 7000+ expert-authored eBooks and videos courses covering every tech area you can think of
Renews at $19.99/month. Cancel anytime