Search icon CANCEL
Subscription
0
Cart icon
Your Cart (0 item)
Close icon
You have no products in your basket yet
Save more on your purchases! discount-offer-chevron-icon
Savings automatically calculated. No voucher code required.
Arrow left icon
Explore Products
Best Sellers
New Releases
Books
Videos
Audiobooks
Learning Hub
Newsletter Hub
Free Learning
Arrow right icon
timer SALE ENDS IN
0 Days
:
00 Hours
:
00 Minutes
:
00 Seconds
Arrow up icon
GO TO TOP
Mastering Android Development with Kotlin

You're reading from   Mastering Android Development with Kotlin Deep dive into the world of Android to create robust applications with Kotlin

Arrow left icon
Product type Paperback
Published in Nov 2017
Publisher Packt
ISBN-13 9781788473699
Length 378 pages
Edition 1st Edition
Languages
Tools
Arrow right icon
Author (1):
Arrow left icon
Miloš Vasić Miloš Vasić
Author Profile Icon Miloš Vasić
Miloš Vasić
Arrow right icon
View More author details
Toc

Table of Contents (17) Chapters Close

Preface 1. Starting with Android FREE CHAPTER 2. Building and Running 3. Screens 4. Connecting Screen Flow 5. Look and Feel 6. Permissions 7. Working with Databases 8. Android Preferences 9. Concurrency in Android 10. Android Services 11. Messaging 12. Backend and API 13. Tuning Up for High Performance 14. Testing 15. Migration to Kotlin 16. Deploying Your Application

Debug your application


Now, we know how to log important application messages. During development, we will face situations when only logging messages is not enough when analyzing application behavior or investigating bugs.

For us, it's important to have the ability to debug an application code during its execution on real Android devices or on emulators. So, let's debug something! Open the main Application class and put the break point on line where we log the onCreate() method, as shown here:
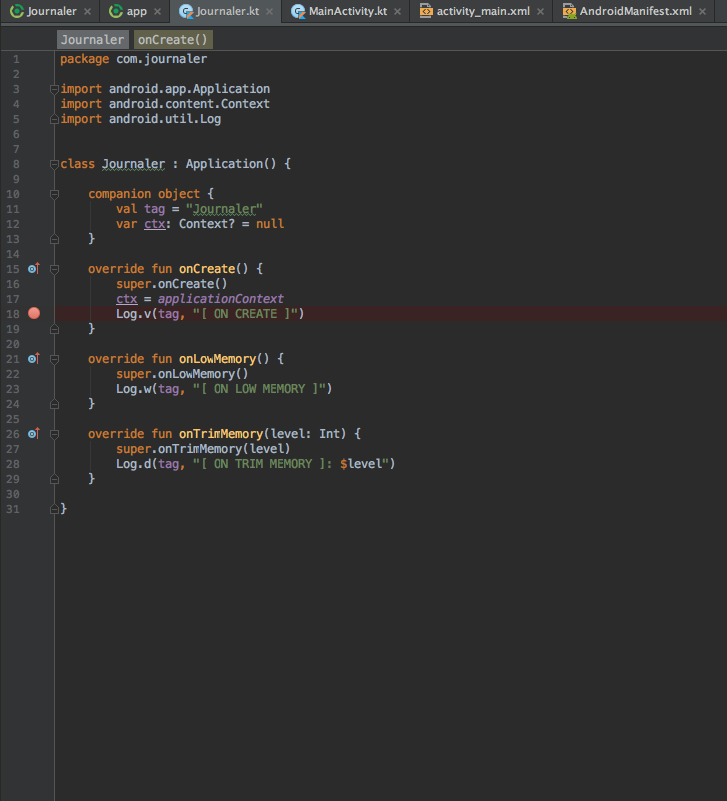
As you can see, we set the break point at line 18. We will add more break points. Let's add it in our main (and only) activity. Put a break point in each lifecycle event at lines where we perform logging. 
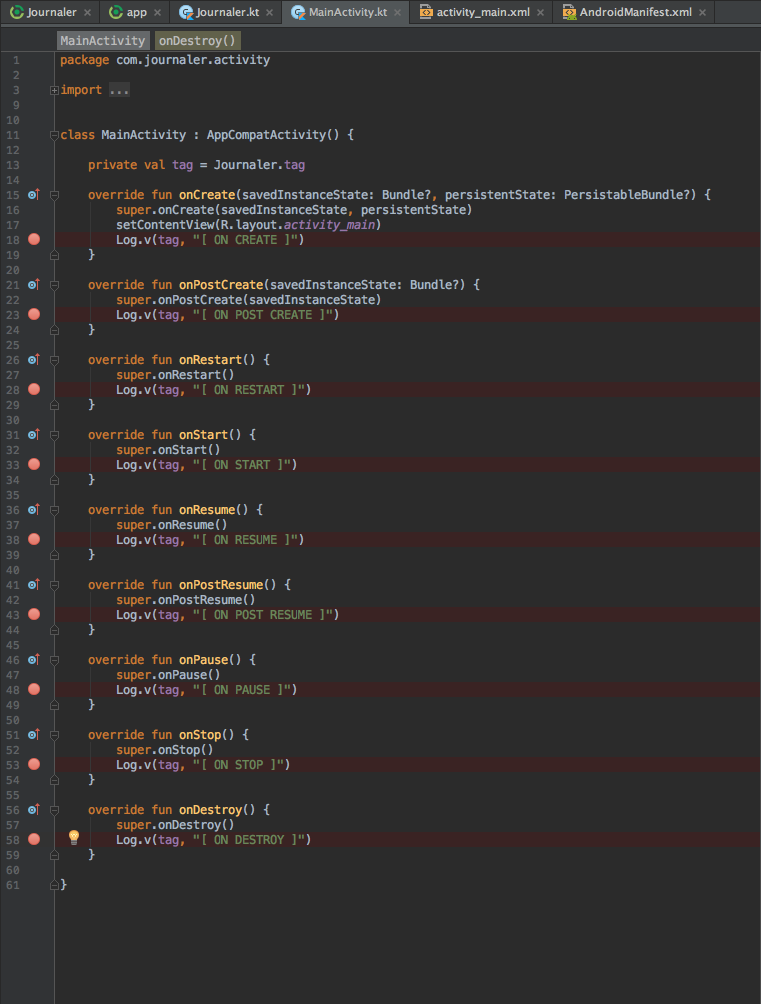
We set breakpoints at lines 18, 23, 28, 33, 38, and so on. Run the application in debug mode by clicking on the debug icon or by choosing Run | Debug app. The application is started in debug mode. Wait a little bit and a debugger will soon enter the first break point we set.

The following screenshot...

lock icon The rest of the chapter is locked
Register for a free Packt account to unlock a world of extra content!
A free Packt account unlocks extra newsletters, articles, discounted offers, and much more. Start advancing your knowledge today.
Unlock this book and the full library FREE for 7 days
Get unlimited access to 7000+ expert-authored eBooks and videos courses covering every tech area you can think of
Renews at $19.99/month. Cancel anytime
Banner background image