The Dshield project
The Dshield project is maintained by the folks at the Internet Storm Center (https://isc.sans.edu) and allows participants to forward their (anonymized) logs to a central repository where they are aggregated to provide a good picture of "what's happening on the internet."
Specifically, the information that is forwarded is the connection attempts that are blocked by your firewall. There is also a dedicated Dshield sensor that can be used if you don't want to use your actual firewall logs. Instructions for participation can be found here: https://isc.sans.edu/howto.html.
This aggregated data gives us a view of what ports malicious actors are looking for, intending to exploit them. The participant's addresses are the information that is anonymized. The various high-level reports can be viewed here: https://isc.sans.edu/reports.html.
In particular, you can drill down into any of the "top 10 ports" on that page to see activity over time on the most popular ports being scanned for. For instance, you can go to https://isc.sans.edu/port.html?port=2222, as shown in the following screenshot:
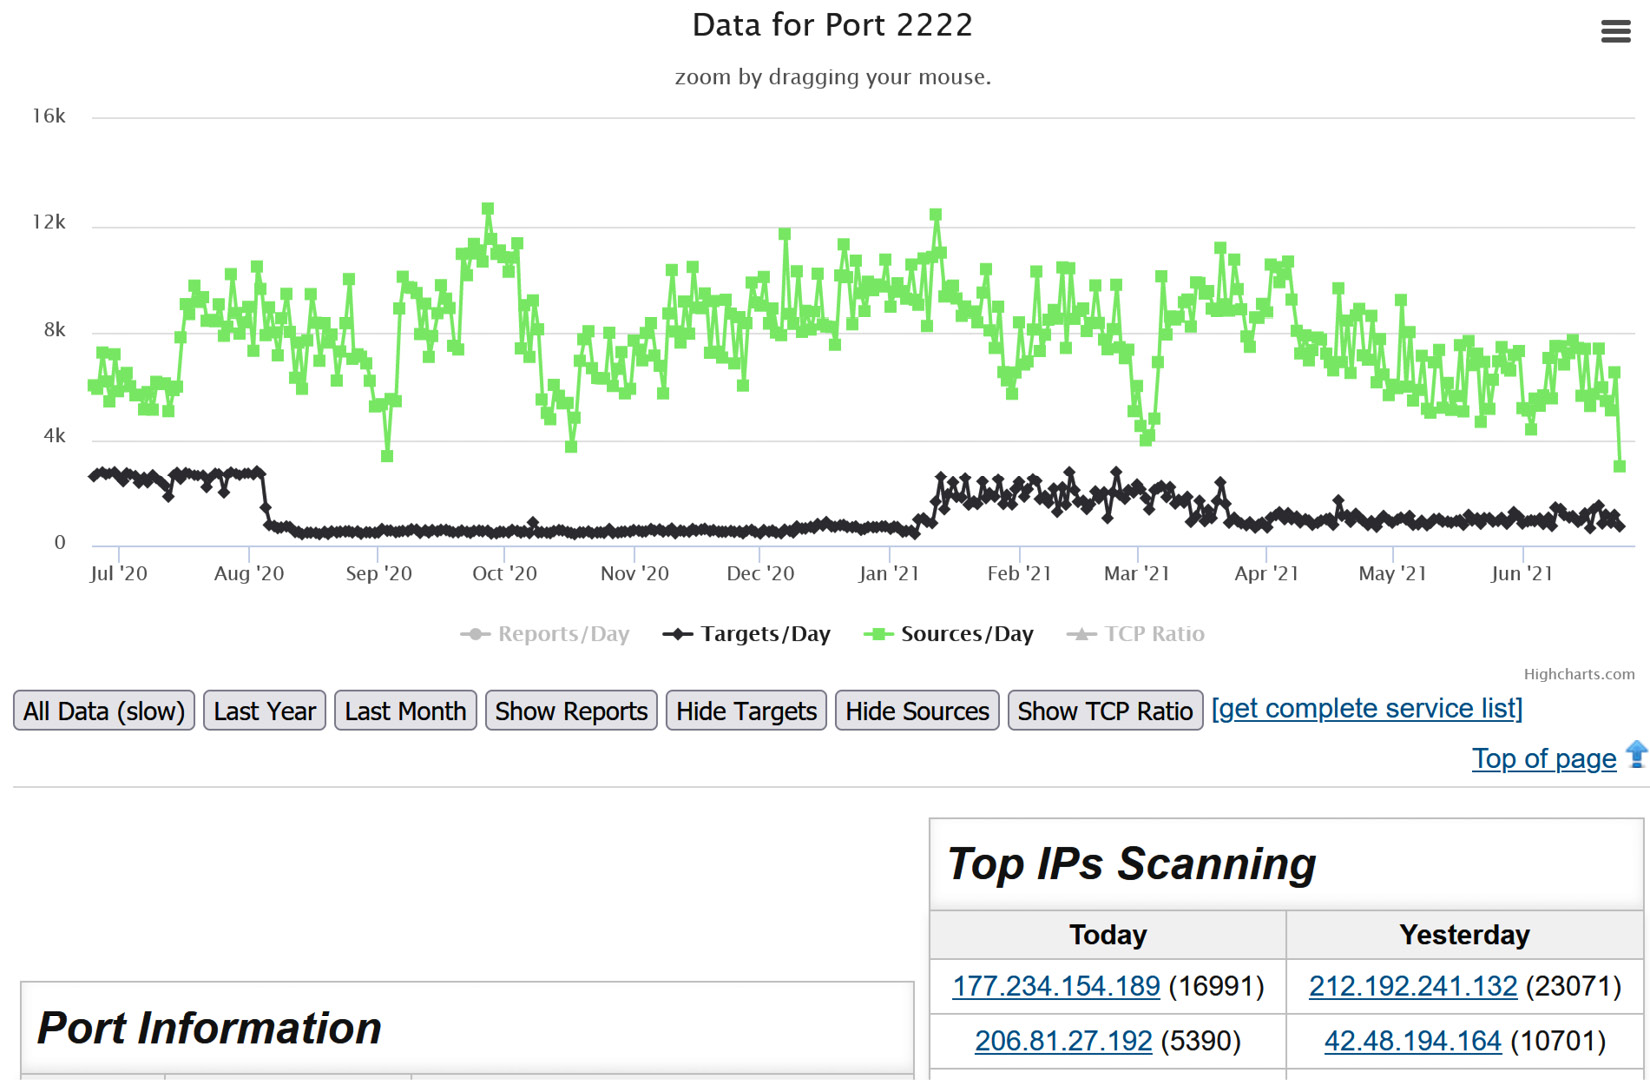
Figure 12.1 – Dshield data for one port
From this pattern, you can see how to query any port if you have specific traffic you might be doing forensics on.
Furthermore, this aggregated information can be queried by an API, if you'd rather consume this using a script or application. The Dshield API is documented here: https://isc.sans.edu/api/.
For instance, to collect the summary information for port 2222, we can use curl (just as an example):
$ curl –s –insecure https://isc.sans.edu/api/port/2222 | grep –v encoding\= | xmllint –format –
<?xml version="1.0"?>
<port>
  <number>2222</number>
  <data>
    <date>2021-06-24</date>
    <records>122822</records>
    <targets>715</targets>
    <sources>3004</sources>
    <tcp>100</tcp>
    <udp>0</udp>
    <datein>2021-06-24</datein>
    <portin>2222</portin>
  </data>
  <services>
    <udp>
      <service>rockwell-csp2</service>
      <name>Rockwell CSP2</name>
    </udp>
    <tcp>
      <service>AMD</service>
      <name><![CDATA[[trojan] Rootshell left by AMD exploit]]></name>
    </tcp>
  </services>
</port>
Because the data is returned in XML in this example, you can consume it using standard libraries or language components. You can also change the returned formatting to JSON, text, or PHP. In some cases, the data lends itself toward comma- or tab-delimited formats (CSV, tab).
To change formats, simply add ?format_type to the query, where format_type can be JSON, text, PHP, or in some cases, CSV or tab.
Each user has their own web portal, which shows these same stats for their own device(s) – this data can be valuable in troubleshooting, or to contrast it against the aggregate data to see if your organization might be targeted by one attack or another. But the strength of this approach is in the aggregated data, which gives a good picture of the internet "weather" on any particular day, as well as overall "climate" trends.
Now that we've got local logging configured and our firewall logs aggregated for better internet traffic analysis, let's consider other network management protocols and approaches, starting with the Simple Network Management Protocol (SNMP) management/performance and uptime.
Network device management using SNMP
At its heart, SNMP is a way to collect information from target network devices. Most often, this is done by a server-based application, but you can certainly query SNMP from the command line There are several versions of SNMP, with two of them in common use today.
SNMPv2c (version 2c) is a slight improvement over the initial v1 protocol, but is still an "old-school" approach to data collection – both the SNMP queries and responses are transferred in clear text over UDP. It is secured using a passphrase (called a community string), but this is also sent in clear text, so tools such as Ettercap can easily collect these – even the often-recommended "long and complex" strings do not protect you if your attacker can simply cut and paste them for reuse. In addition, the default community strings (public for read-only access and private for read-write access) are often left in place, so just querying using those can often yield good results for an attacker. It's often recommended that the access to SNMP be protected by an ACL at the target device. However, given how easy it is to perform ARP poisoning attacks, a well-positioned attacker can easily bypass these ACLs as well.
SNMPv3 is the most recent version of the protocol and adds a most welcome encryption feature. It also has a much more nuanced approach to access controls, as opposed to the "either read or read/write" access controls that SNMPv2c offers.
As we mentioned previously, SNMP (either version) can be used to "poll" a target device for information. In addition, that device can send an unsolicited SNMP "trap" to an SNMP server or log collector. SNMP polls use 161/udp, and SNMP traps are sent to 162/udp (though TCP can be configured).
With some of the background covered, let's make a few example queries.
Basic SNMP queries
Before you can make command-line queries in Linux, you likely need to install the snmp package:
$ sudo apt-get install snmp
Now, we can make an example query. In our first example, I'm collecting the IOS version of a lab switch:
$ snmpget –v2c –c <snmpstring> 192.168.122.7 1.3.6.1.2.1.1.1.0
iso.3.6.1.2.1.1.1.0 = STRING: "SG550XG-8F8T 16-Port 10G Stackable Managed Switch"
To collect the system uptime, in both seconds and in a human-readable timestamp, use the following command:
$ snmpget -v2c -c <snmpstring> 192.168.122.7 1.3.6.1.2.1.1.3.0
iso.3.6.1.2.1.1.3.0 = Timeticks: (1846451800) 213 days, 17:01:58.00
What about the stats for an interface? Let's start with the name:
snmpget -v2c -c <snmpstring> 192.168.122.7 .1.3.6.1.2.1.2.2.1.2.2
iso.3.6.1.2.1.2.2.1.2.2 = STRING: "TenGigabitEthernet1/0/2"
Then, we can get packets in and out (unicast):
$ snmpget -v2c -c <snmpstring> 192.168.122.7 .1.3.6.1.2.1.2.2.1.11.2
iso.3.6.1.2.1.2.2.1.11.2 = Counter32: 4336153
$ snmpget -v2c -c public 192.168.122.7 .1.3.6.1.2.1.2.2.1.17.2
iso.3.6.1.2.1.2.2.1.17.2 = Counter32: 5940727
You get the idea – there's an OID for just about every common parameter. But how do we keep them all straight?
First of all, this is standardized in RFC 1213, with MIB-2 being the latest set of definitions that most vendors support as a "lowest common denominator" implementation. Secondly, the definition is hierarchal. This shows the "top" of the basic tree, with the OID for mib-2 highlighted:
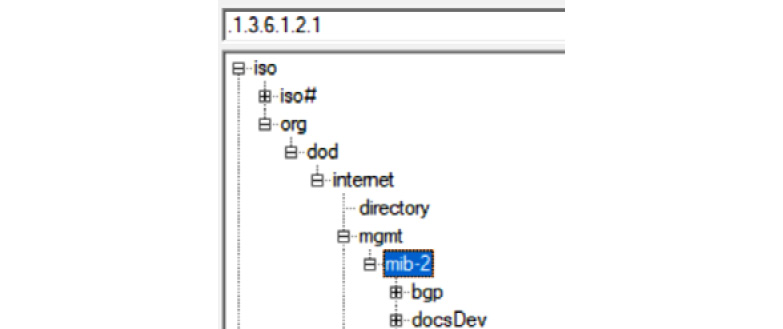
Figure 12.2 – SNMP OID tree, showing mib-2
When there are a group of interfaces, there'll be a count, then a table for each interface statistic (by interface index). If you use snmpwalk instead of snmpget, you can collect the entire list, along with all the sub-parameters for each entry. This shows the beginning of the ifTable (Interface Table) part of mib-2:
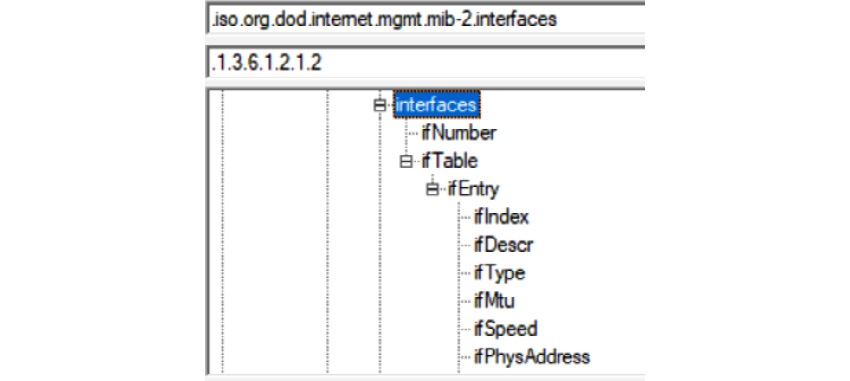
Figure 12.3 – SNMP OID tree, showing interface information (ifTable)
In addition, they maintain a list of the "starting points" of the OIDs that each vendor has their custom tree of items under. The top of the private branch of the OID tree is shown here. Note that toward the top of the tree, you will tend to find several organizations that may have either been acquired or are not commonly seen anymore in enterprise environments for one reason or another:
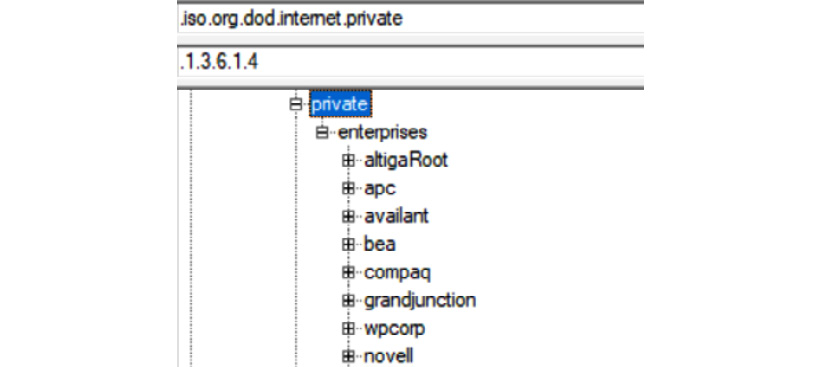
Figure 12.4 – SNMP OID tree, showing the Vendor OID section
This model all hangs together more or less nicely, with the various devices maintaining their various counters, waiting on a valid server to query for those values.
If you have a starting point, you can use the snmpwalk command to traverse the tree of OIDs from that point down (see the SNMPv3 section for an example). Needless to say, this can turn into a messy business of "find me the number I really want," spread across hundreds of lines of text.
Also, as you can see, each "node" in the SNMP tree is named. If you have the appropriate definitions, you can query by name rather than OID. You likely already have the MIB-2 definitions installed on your Linux host, so you can import and manage vendor MIB definitions as well. An easy way to install or manage the various MIB definitions is to use the snmp-mibs-downloader package (install this using our familiar apt-get install approach).
To install a vendor's MIBs, we can use Cisco (as an example). After installing snmp-mibs-downloader, edit the /etc/snmp-mibs-downloader/snmp-mibs-downloader.conf file and add the cisco designator to the AUTOLOAD line . This line should now look like this:
AUTOLOAD="rfc ianarfc iana cisco"
The definitions of where and how to collect the cisco MIBs are in /etc/snmp-mibs-downloader/cisco.conf:
# Configuarions for Cisco v2 MIBs download from cisco.com
#
HOST=ftp://ftp.cisco.com
ARCHIVE=v2.tar.gz
ARCHTYPE=tgz
ARCHDIR=auto/mibs/v2
DIR=pub/mibs/v2/
CONF=ciscolist
DEST=cisco
The individual MIB definitions are in /etc/snmp-mibs-downloader/ciscolist – as you can see, this file is too long to list here:
# cat :/etc/snmp-mibs-downloaderciscolist | wc -l
1431
Once you've updated the snmp-mibs-downloader.conf file, simply run the following command:
# sudo download-mibs
You'll see each MIB file get downloaded (all 1,431 files).
With the MIB text descriptions now loaded (the defaults are loaded after installing snmp-mibs-downloader), you can now query SNMP using text descriptions – in this case, we'll query the sysDescr (System Description) field of a lab switch:
snmpget -Os -c <snmpstring> -v2c   192.168.122.5 SNMPv2-MIB::sysDescr.0
sysDescr.0 = STRING: SG300-28 28-Port Gigabit Managed Switch
Even using the descriptive field names, this process gets very complicated very quickly – this is where a Network Management System (NMS) comes in. Most NMS systems have a point-and-click web interface, where you start with the IP and can drill down by interface or other statistics to get the information you want. It then presents that information graphically, usually over time. Most of the better NMSes will figure out what the device is and create all the graphs you'll typically want, without further prompting.
Where does this break down?
The clear-text nature of SNMPv2 is an ongoing problem – many organizations simply have not moved on to SNMPv3, with its more secure transport.
Even worse, many organizations have simply continued using the default SNMP community strings; that is, "public" and "private." In almost all cases, there is no need for read-write access to SNMP, but people configure it anyway. This situation is made worse by the fact that not only can you shut down interfaces or reboot a device if you have read/write access, but you can generally retrieve a full device configuration with that access – there's even a nmap script to retrieve a Cisco IOS running configuration.
Operationally, if you query every interface and statistic on a device, you will often impact the CPU of that device. Historically, especially on switches, if you query every interface, you will (on one version or the other of the operating system) find memory leak bugs. These can be so bad that you can graph the memory utilization and see a straight line increase where these queries don't return a few bytes per query, eventually to the point where there isn't enough memory left for the device to run.
So, these were the obvious recommendations. Use SNMPv3, restrict SNMP access to known servers, and only query interfaces that you need. On firewalls and routers, this may include all interfaces, but on switches, you will often only query uplinks and interfaces for critical servers – hypervisors, in particular.
With some of the theory covered, let's build a popular Linux-based NMS – LibreNMS.
SNMP NMS deployment example – LibreNMS
LibreNMS is an NMS that has been forked from the Nagios NMS (which is now a mostly commercial product) and is fairly full-featured for a free NMS application. More importantly, the learning curve to get your devices enrolled is pretty simple, and the installation can be simplified tremendously.
First of all, the installation documentation for LibreNMS is very complete and covers all of the various database, website, and other dependent components. We won't cover those instructions here since they change from version to version; the best source is the vendor download page.
But rather than installing from scratch, often, it's much simpler to use any one of the pre-installed images and start from there. VMware and Hyper-V are both very widespread hypervisors and are the main compute platforms in many enterprises. For these, LibreNMS has a complete Ubuntu install in a pre-packaged Open Virtualization Format (OVA) file. In fact, as the name suggests, that file type is almost universally supported to deploy pre-built VM images.
For the examples in this chapter, you can download and import the OVA file for LibreNMS. The gear you have to query will be different than the examples, depending on what is in your environment, but the core concepts will remain the same. A great side effect of deploying an NMS is that, like logging and log alerting, you are likely to find problems you didn't know you had – everything from an overheating CPU to an interface operating at maximum or "too close to maximum" capacity.
Hypervisor specifics
Be sure that the network you deploy your LibreNMS VM on has access to the devices that you will be monitoring.
In VMware, the default disk format for this VM is "thin provisioned." This means that the virtual disk will start by being just big enough to hold the files that it has on it, and will grow as the file storage needs more. This is fine for a lab/test VM, but in production, you will almost always want a "thick provisioned" disk – you don't want a server "growing" unexpectedly and maxing out your storage. This never ends well, especially if you have multiple servers thin-provisioned in the same datastore!
Once deployed, you'll need to log in using the librenms account – the password for this does change from version to version, so be sure to refer to the documentation for your download. Once logged in, note that this account has root privileges, so change the password for librenms using the passwd command.
Get your current IP address using the ip address command (see Chapter 2, Basic Linux Network Configuration and Operations – Working with Local Interfaces). Consider that this host will be monitoring critical devices using SNMP and that you will likely want to add an ACL to each of these devices to restrict access to SNMP – given that you will want to manually set your IP address, subnet mask, gateway, and DNS server to static values. You can do this using a static DHCP reservation or you can assign it statically on the server – choose whichever approach is your organization's standard.
Once this is done, browse to that address using HTTP, not HTTPS. Given the sensitivity of the information on this server, I'd recommend installing a certificate and forcing the use of HTTPS, but we won't cover that in this chapter (the LibreNMS documentation does a great job of walking through this, though). The web login is also librenms, but the default password for this will be different; consult the documentation for your download for this as well.
You should now have an Edit Dashboard splash screen:
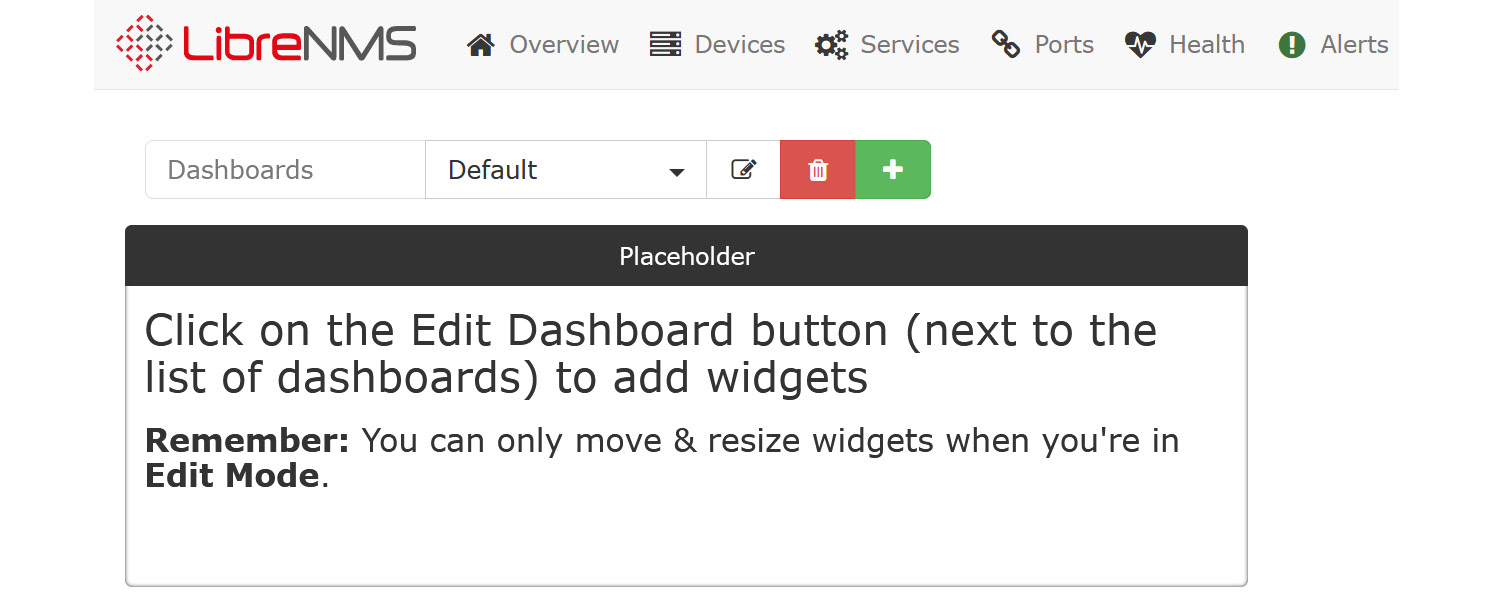
Figure 12.5 – LibreNMS Edit Dashboard startup screen
Before you go any further, click on the librenms account icon in the upper right of your screen:

Figure 12.6 – LibreNMS "Account" and "System" icons
Then, update the password for the web account as well:
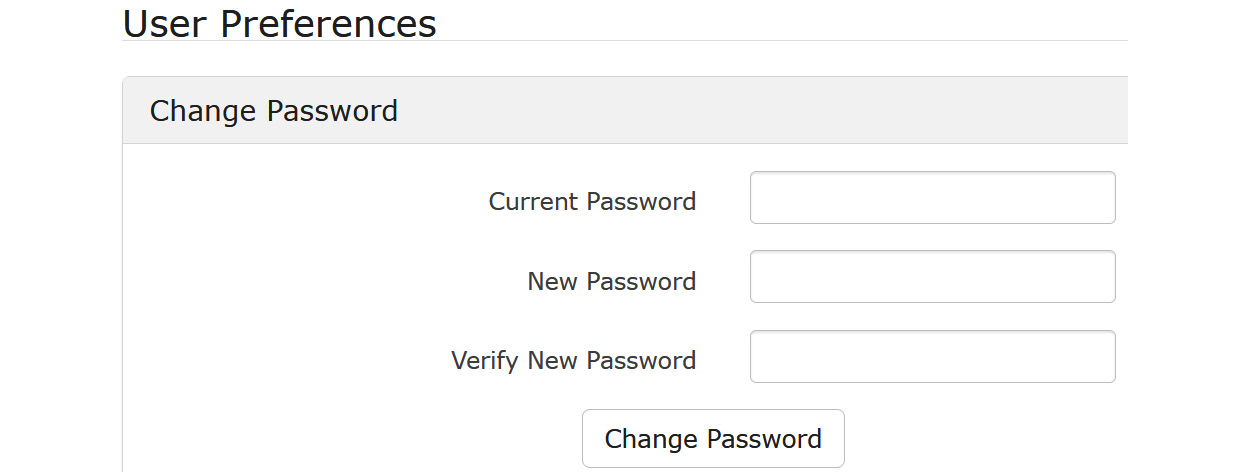
Figure 12.7 – Changing default passwords in LibreNMS
With the server up and running, let's take a look at adding some devices to manage.
Setting up a basic SNMPv2 device
To add the most basic of devices, you'll want to go to that device. You'll want to enable SNMP (version 2, in this case), and then add a community string and hopefully also an ACL to restrict access. On a typical Cisco switch, for instance, this would look like this:
ip access-list standard ACL-SNMP
 permit 192.168.122.174
 deny   any log
snmp-server community ROSNMP RO ACL-SNMP
That's it! Note that we used ROSNMP for the SNMP Community string – that's much too simple for a production environment. Also, note that the RO parameter ensures that this is string allows only read-only permissions.
Now, back in LibreNMS, from the main dashboard, choose Devices > Add Device:
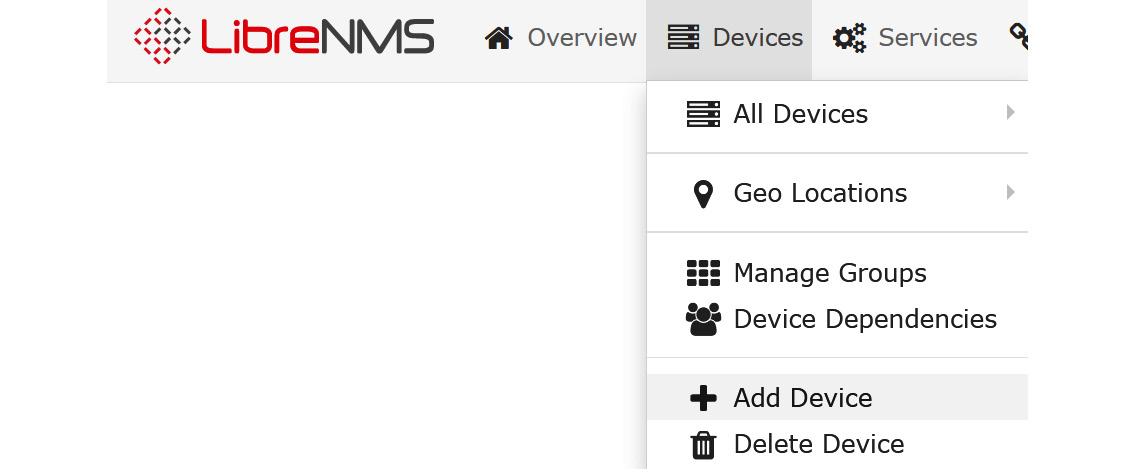
Figure 12.8 – Adding a device to LibreNMS
Fill in the IP address of your device, as well as the community string. Your screen should look something like this (with your own device's IP address, of course):
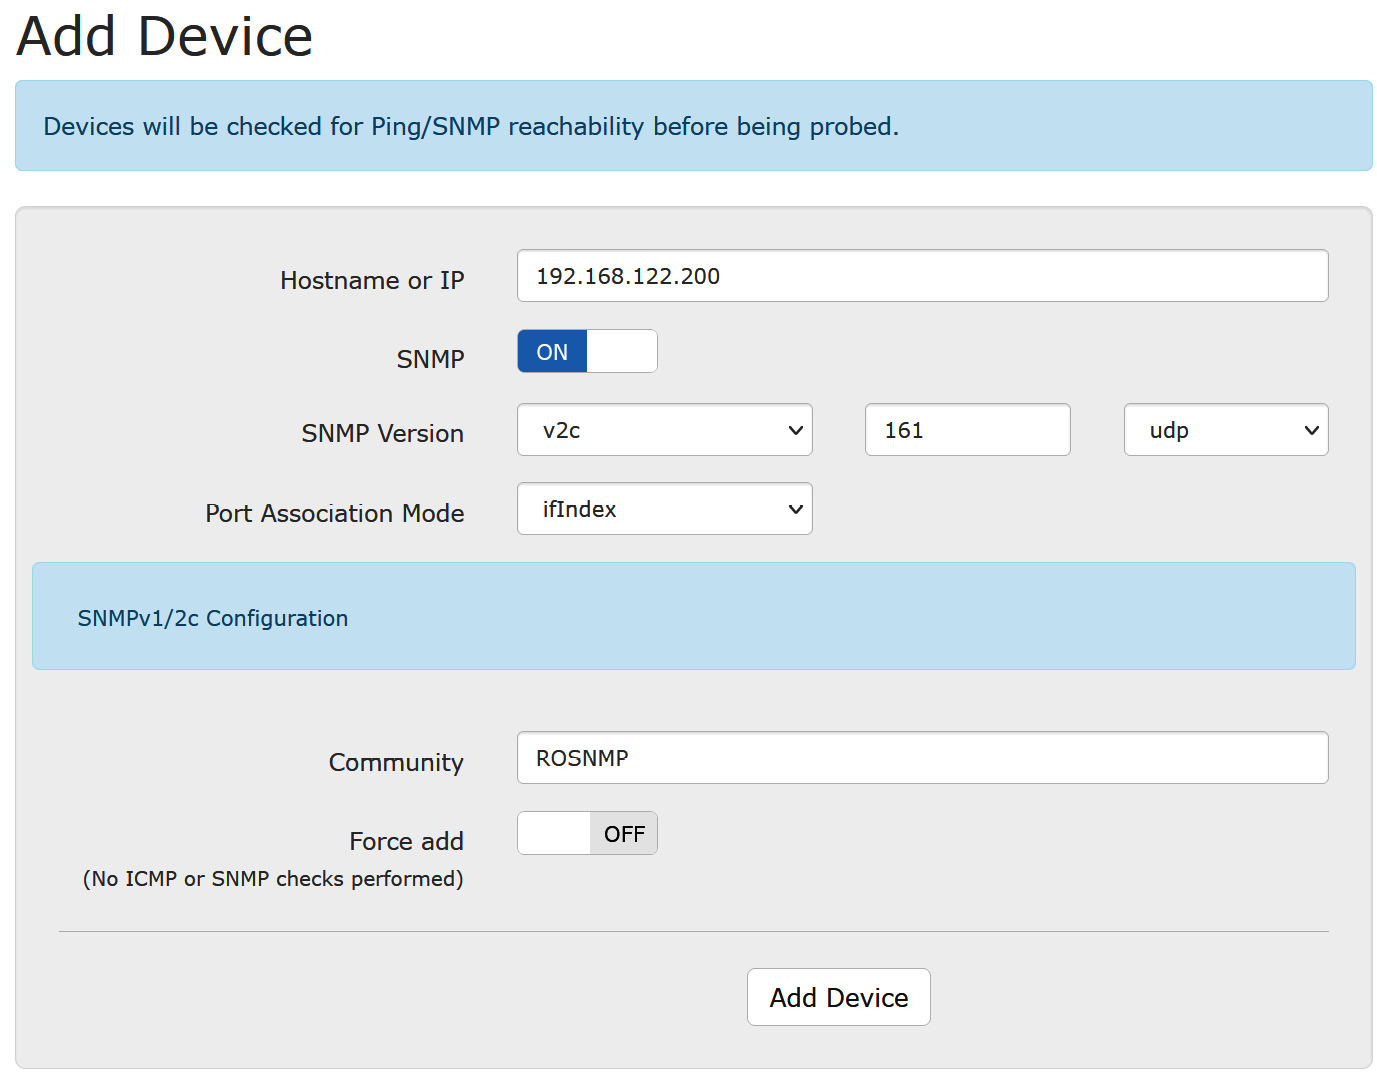
Figure 12.9 – Adding device details in LibreNMS
Now, you can browse to the device you just added by selecting Devices > All Devices and then clicking your device.
Note that LibreNMS has already started graphing CPU and memory utilization, as well as traffic for both the overall device and each interface that is up. The default page for a network device (in this case, a firewall) is shown here:
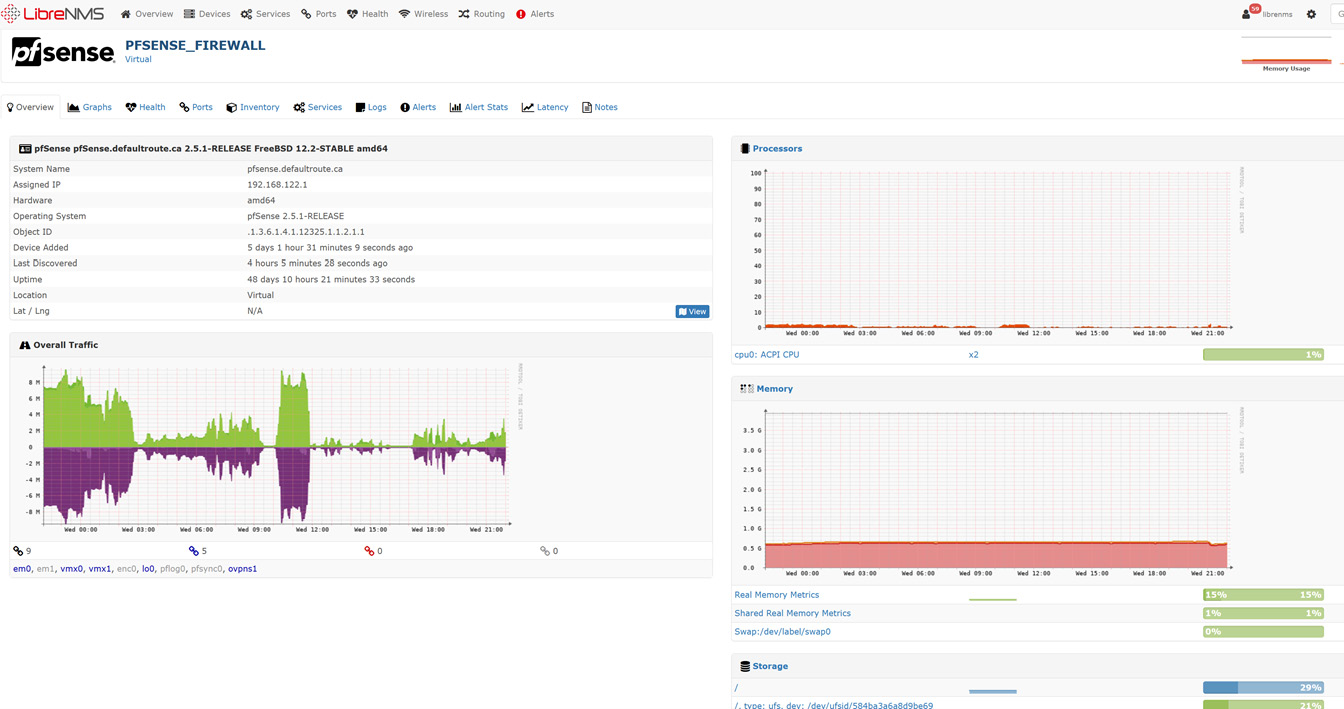
Figure 12.10 – Device statistics collected in LibreNMS
As you drill down into any particular clickable link or graph, further details on collected statistics will be shown. Often, even mousing over a link will flash up the details – in this case, by mousing over the vmx0 link, details about that specific interface are shown:
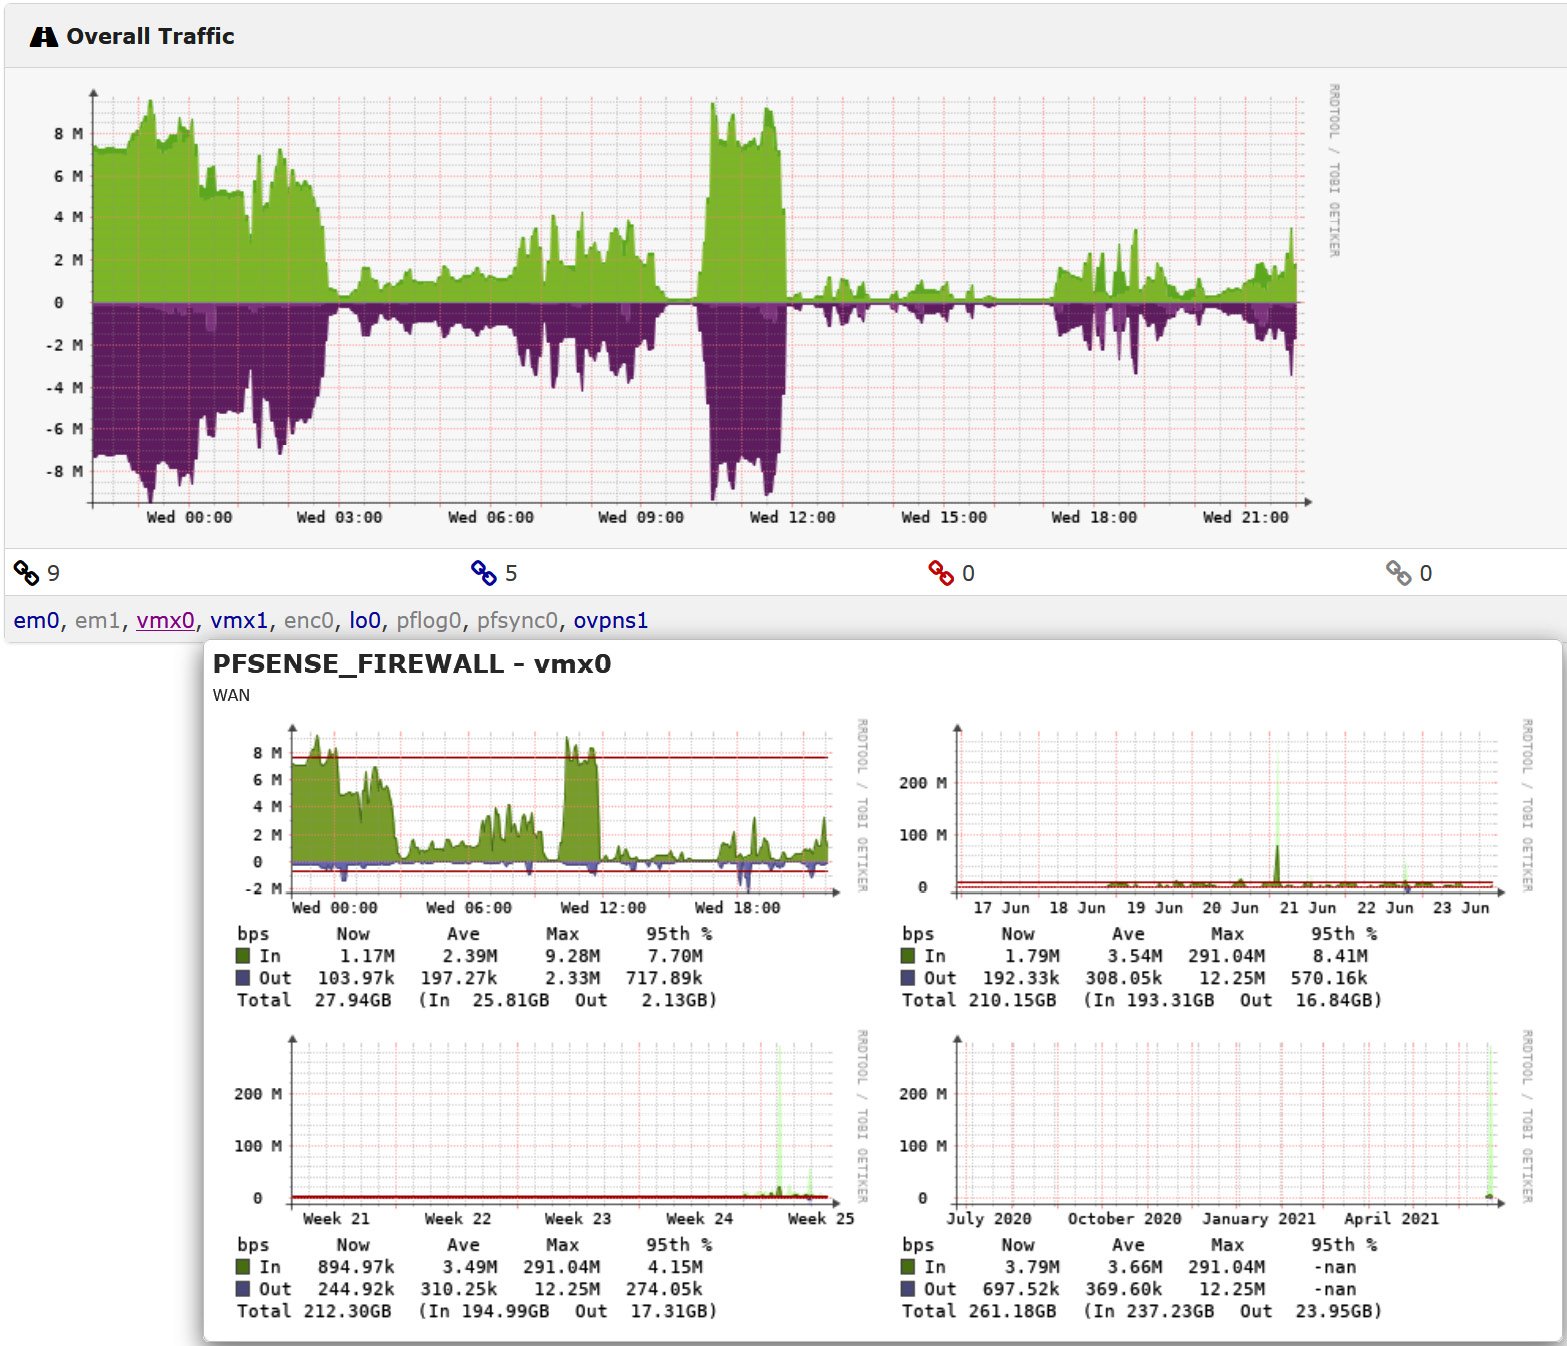
Figure 12.11 – Mousing over an interface for interface details in LibreNMS
We've already talked about how deploying SNMPv2 is risky, due to its clear-text nature and simple authentication. Let's look at fixing that by using SNMPv3 instead.
SNMPv3
SNMP version 3 is not much more complex to configure. In most cases, we take the default "read-only" SNMP views and just add a passphrase to use for authentication and an encryption key. On the device side, this is an example Cisco IOS configuration:
ip access-list standard ACL-SNMP
    permit 192.168.122.174
    deny   any log
snmp-server view ViewDefault iso included
snmp-server group GrpMonitoring v3 priv read ViewDefault access ACL-SNMP
snmp-server user snmpadmin GrpMonitoring v3 auth sha AuthPass1 priv aes 128 somepassword
The key parameters are as follows:
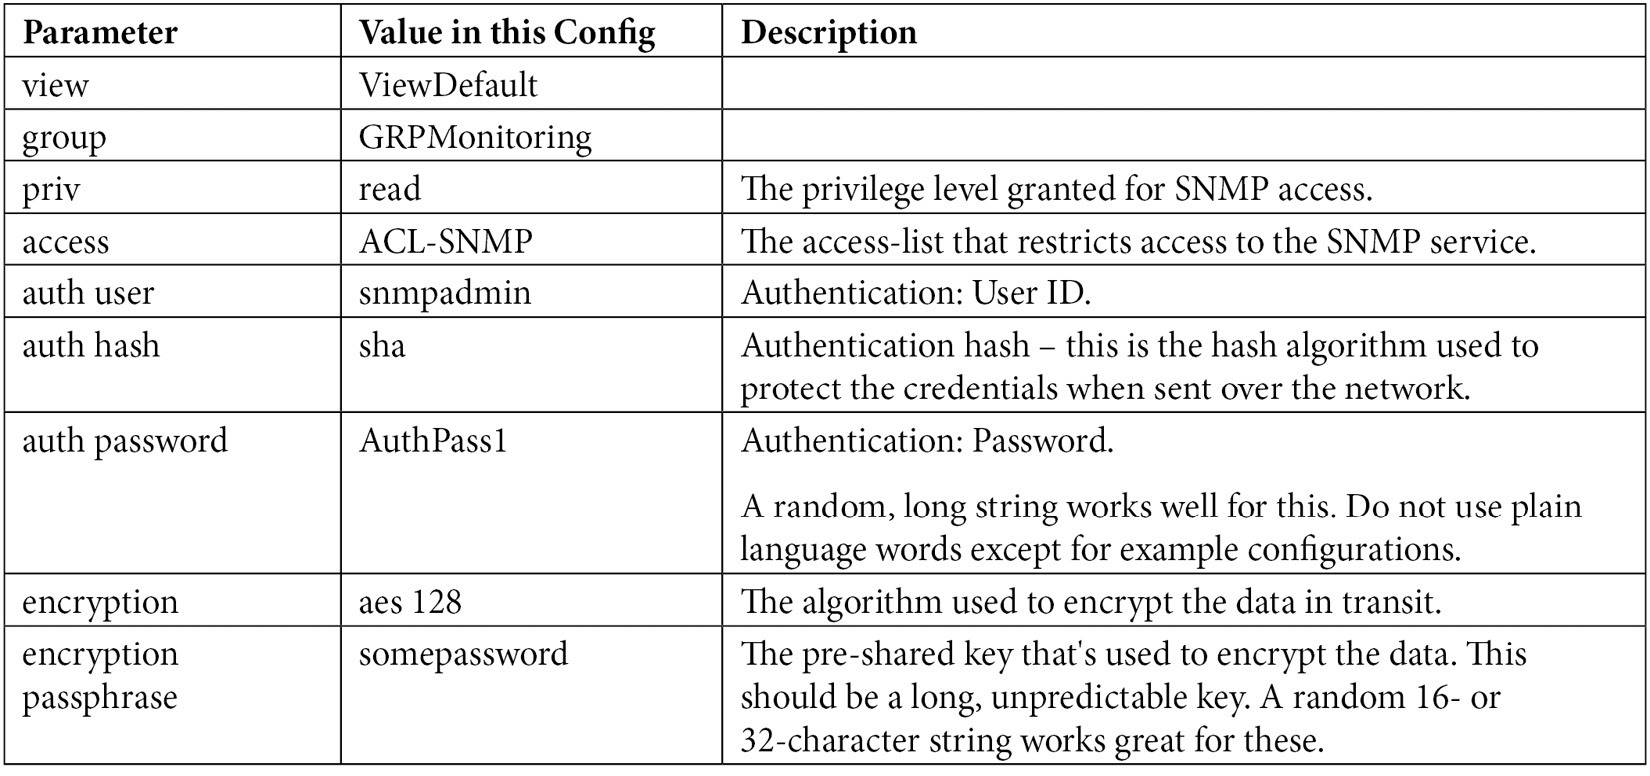
We can test this with the snmpwalk or snmpget commands. For instance, the snmpwalk command pulls the system description values (note that we'll need the calling station's IP in the ACL-SNMP access list):
$ snmpwalk -v3 -l authPriv -u snmpadmin -a SHA -A AuthPass1 -x AES -X somepassword 192.168.122.200:161 1.3.6.1.2.1.1.1.0
iso.3.6.1.2.1.1.1.0 = STRING: "Cisco IOS Software, CSR1000V Software (X86_64_LINUX_IOSD-UNIVERSALK9-M), Version 15.5(2)S, RELEASE SOFTWARE (fc3)
Technical Support: http://www.cisco.com/techsupport
Copyright (c) 1986-2015 by Cisco Systems, Inc.
Compiled Sun 22-Mar-15 01:36 by mcpre"
On the NMS side, it's as simple as matching the various configuration passwords and parameters that we used on the device:
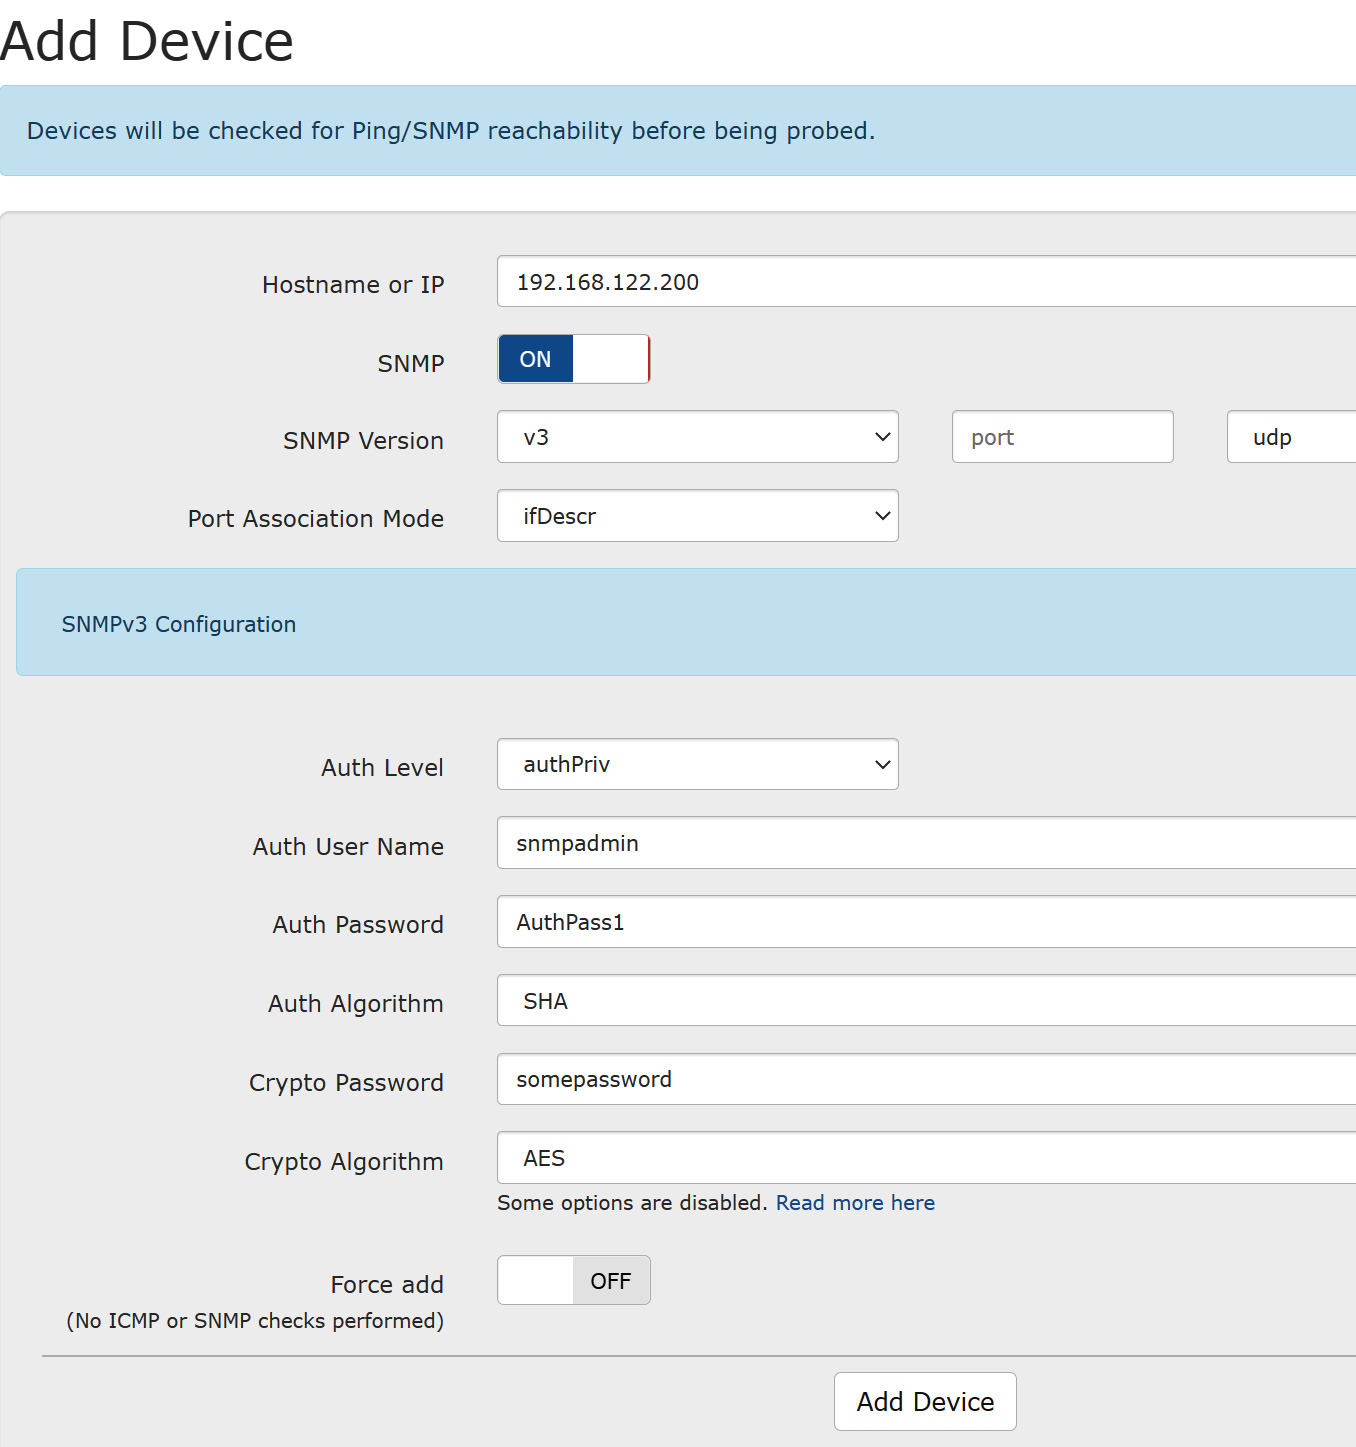
Figure 12.12 – Adding a device to the LibreNMS inventory using SNMPv3
After enrollment, we can fix the device's name by editing the device, then changing the device's name to something that's more easily remembered, and adding an IP overwrite (which the NMS will use for access). Of course, if the device has a DNS name, then enrolling it using its FQDN would work too. Relying on DNS can become a problem though if you need the NMS for troubleshooting when DNS might not be available – in fact, you might be troubleshooting DNS!

Figure 12.13 – Changing the device's name and adding an "Overwrite IP" in LibreNMS
Note that even though we have added true authentication (using a hashed password in transit) and authorization to the mix (by adding authorizing to the access level), as well as encryption of the actual data, we're still adding a plain old access list to protect the SNMP service on the router. The mantra of "Defense in Depth" has us thinking that it's always best to assume that one or more protection layers might be compromised at some point, so adding more defensive layers to any target service will protect it that much better.
We can expand SNMPv3 usage by using it to send SNMP trap messages, which are encrypted, to replace plain-text syslog logging. This complicates our log services somewhat, but is well worth it!
Additional security configurations are available for SNMPv3; the CIS Benchmark for your platform is normally a good reference for this. The CIS Benchmark for Cisco IOS makes a good starting point if you just want to dig deeper, or if your router or switch doesn't have a Benchmark or good security guidance from the vendor.
Aside from the additional protection provided, the underlying SNMP capabilities remain almost the same between SNMP versions 2 and 3. Once enrolled in the NMS, devices using SNMPv2 and SNMPv3 do not operate or appear different in the system in any significant way.
Now that we're monitoring all of our various network-connected devices and servers using SNMP, can we use the polling engine of our NMS to add alerts to monitor for devices or services that go down?
Alerts
One of the main things you'll want to do is add some alerts to go with your stats. For instance, if you go to Alerts > Alert Rules and click Create rule from collection, you'll see this screen:
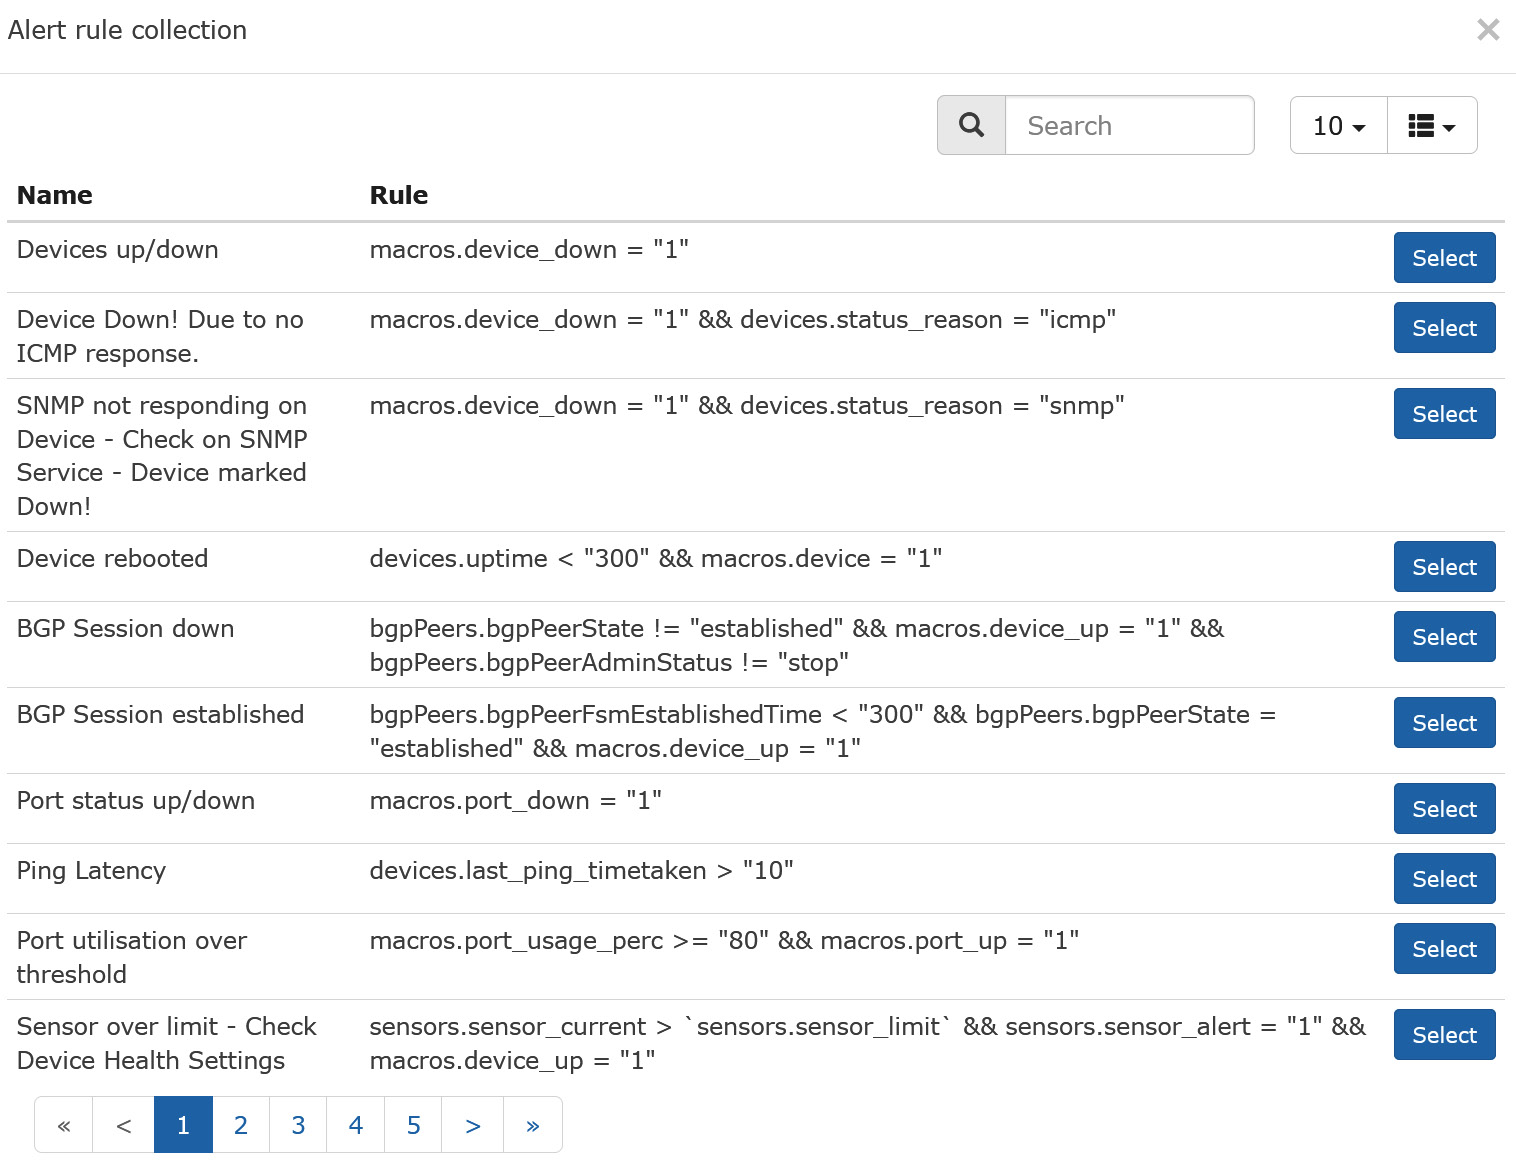
Figure 12.14 – Default alert collection in LibreNMS
Let's add an alert that will trigger on any interface at over 80% utilization. To see if there is something like this in the default collection, type utili into the Search field – as you type, the search will be narrowed down:
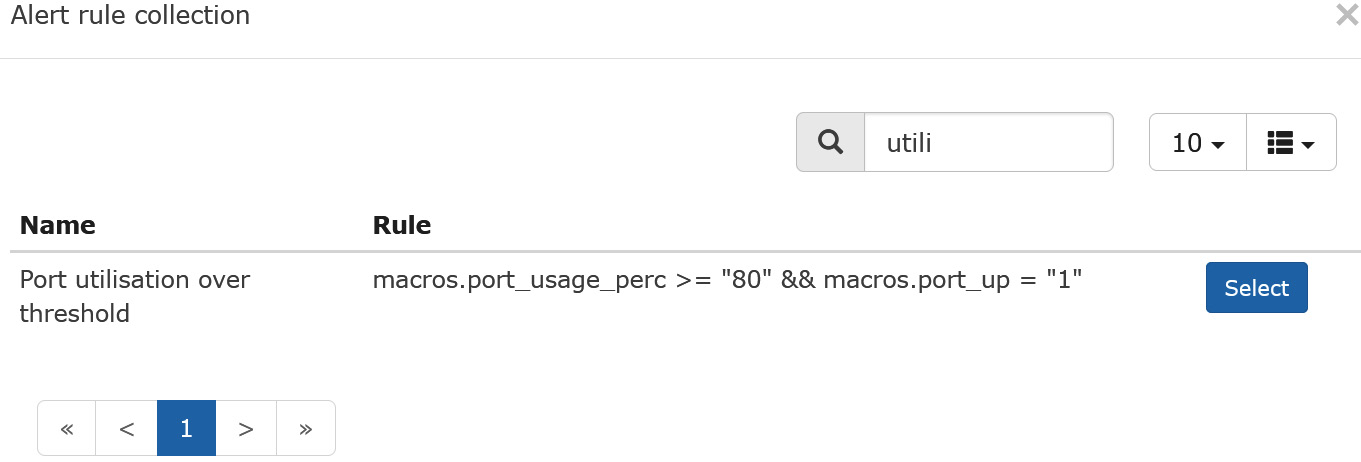
Figure 12.15 – Adding an alert in LibreNMS
Select the rule; we'll get some options:
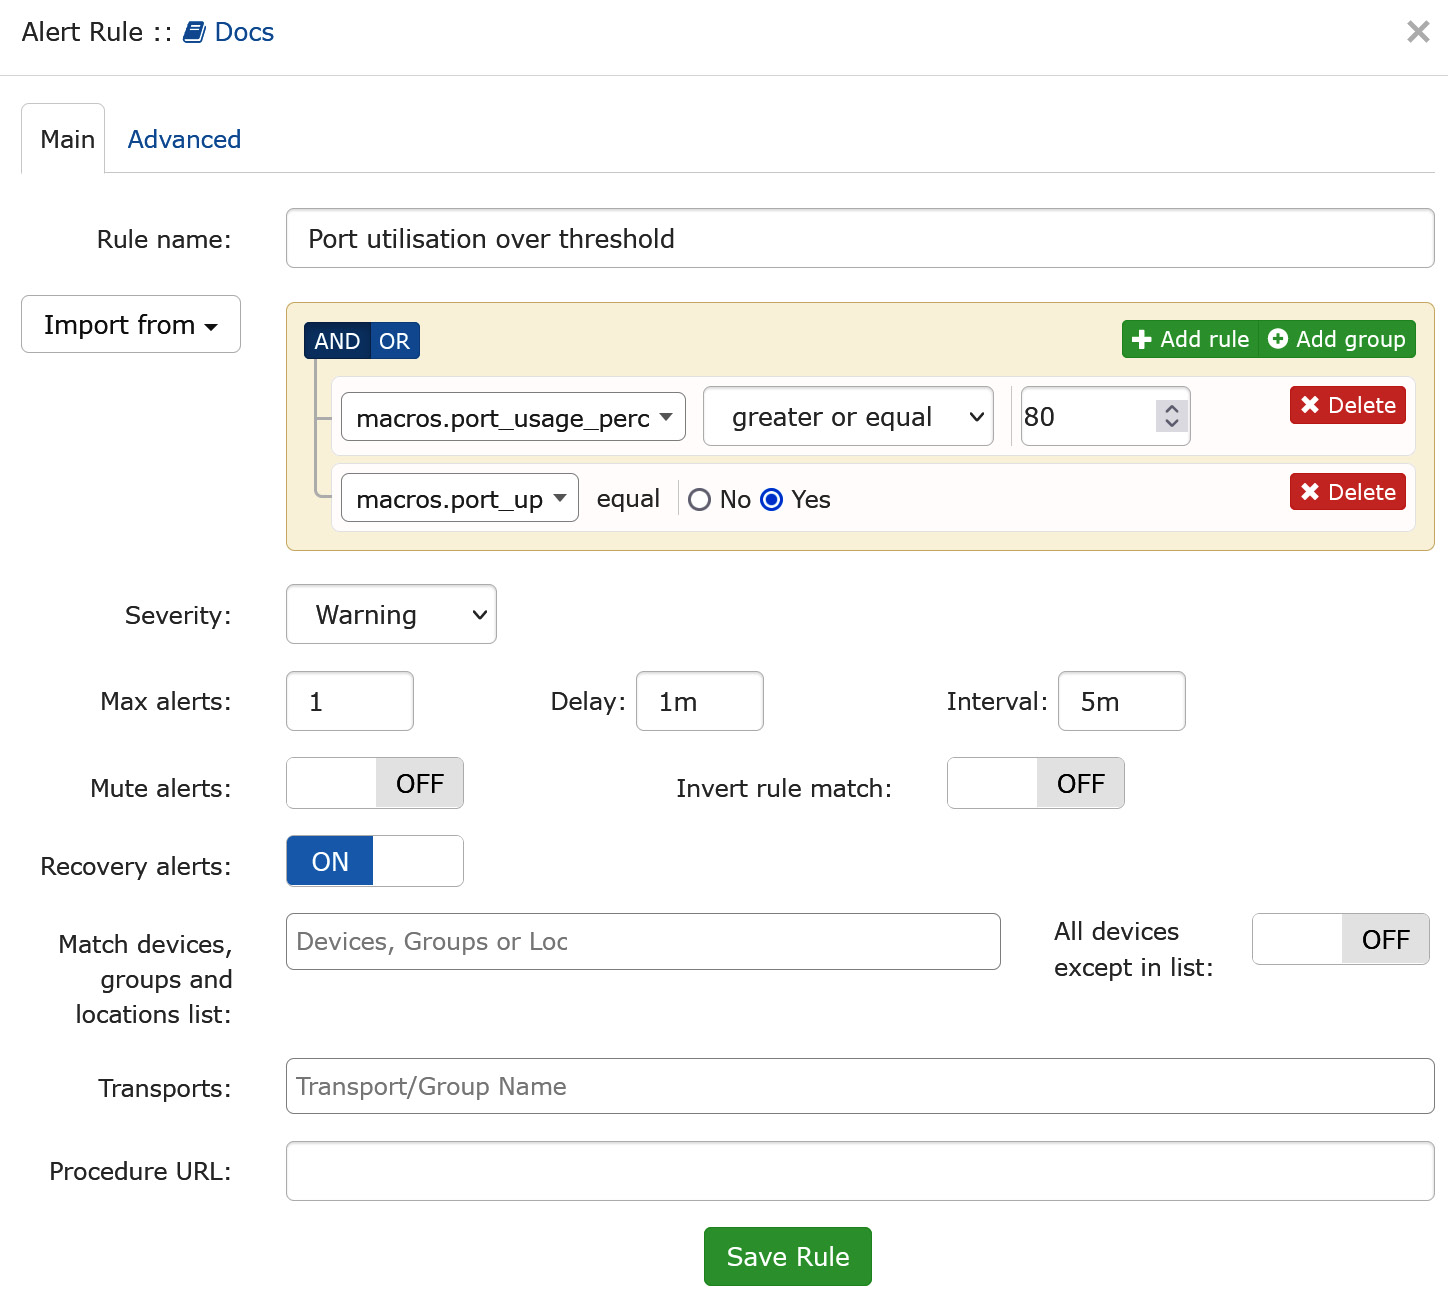
Figure 12.16 – Alert rule options in LibreNMS
Starting from the top, you should rename the rule. If you decide to import the default ruleset, you don't want to have things failing because you tried to have duplicate rule names. Often, I'll name custom rules so that they start with an underscore character; this ensures that they are always at the top of the rule list when sorted. Since we're taking a copy of what's in the collection, we can easily also change the percentage that triggers the alert.
Regarding Match devices, groups and locations list, things get tricky. As it stands, there's nothing in the match list, and All devices except in the list is set to OFF, so this rule won't match anything. Let's select our device:

Figure 12.17 – Matching devices and groups within an alert rule in LibreNMS
Now, save the rule. Yes, it is that easy!
Did you happen to notice the Groups pick in the preceding menu? Using device groups is a great way to assign one rule to all similar devices – for instance, you might have a different port threshold for a router or a switch port. The reason for this is that increasing a router's WAN link speed might take weeks, as opposed to changing a switch port, which might involve just moving the cable from a 1G port to a 10G port (for instance). So, in that case, it makes good sense to have one rule for all routers (maybe at 60%) and a different rule for all switches (set at some higher number).
Explore the rules – you'll see many that you likely want to enable – alerts for device or service down, CPU, memory or interface utilization, and temperature or fan alerts. Some of these alerts depend on syslog – and yes, LibreNMS does have a syslog server built into it. You can explore this at Overview > Syslog:
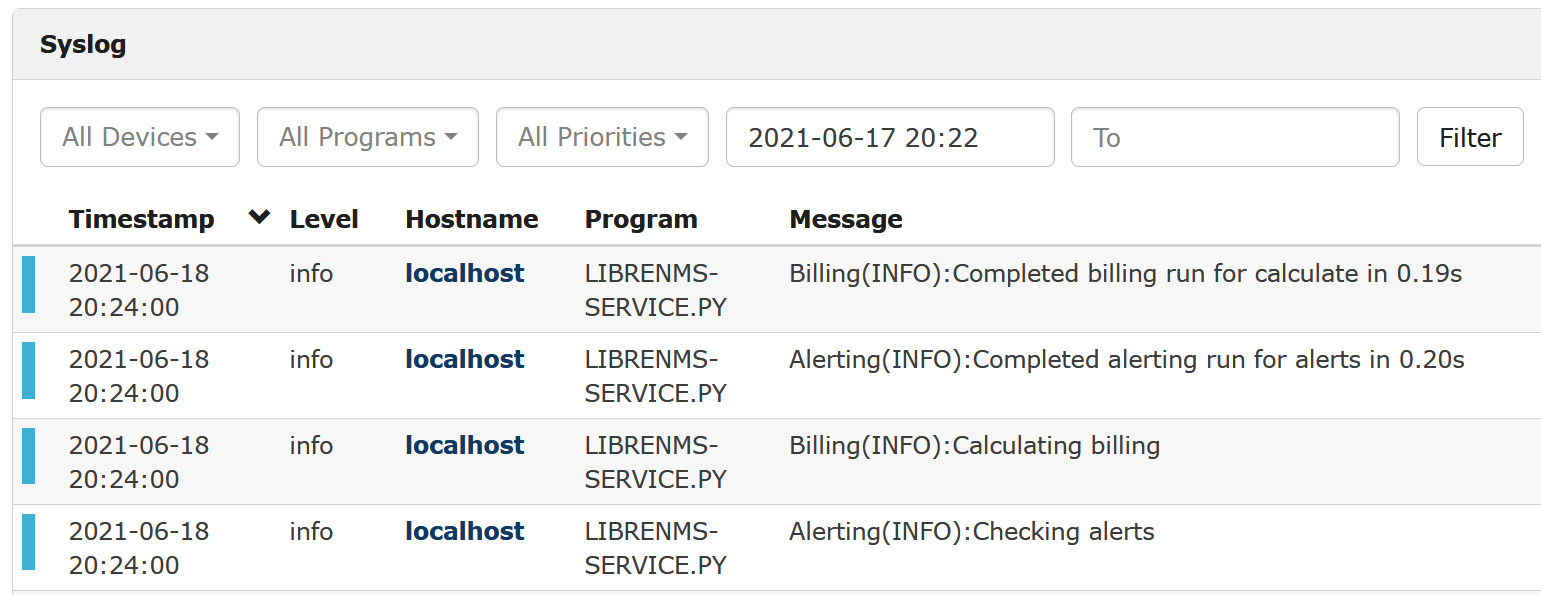
Figure 12.18 – Syslog display in LibreNMS
Note that there is some simple searching available to you, but it is pretty simple. This syslog server is a good thing to use so that the alerts can monitor it – this will be much simpler than the alerting we set up earlier in this chapter. However, you'll still want to keep those text logs we set up, both for better searching and for longer-term storage.
As we add devices to our NMS, or for that matter as we deploy devices and name them, there are some things we should keep in mind.
Some things to keep in mind as you add devices
As you add devices and groups, be sure to name them, especially the devices, so that they sort logically. Naming conventions will often use the device's type (FW, SW, or RT, for instance) a standard for location name (branch number, for instance), or a short form of the city name – (CHI, TOR, and NYC for Chicago, Toronto, and New York City, for instance). The important things are consistency, planning out how things will sort, and keeping the various terms in the name short – remember, you'll be typing these things, and they'll also end up in spreadsheet columns eventually.
So far, we've focused on using SNMP to monitor statistics. Now, let's monitor a running service on a device.
Monitoring services
Keep in mind that services on hosts are key things to monitor. It's common to monitor ports for database access, APIs, and web and VPN services using a nmap-like function in the NMS. A more advanced monitor will poll a service and ensure that the data coming back from the poll is correct.
Before we can monitor for services, we'll need to enable service checks. SSH to your LibreNMS host and edit the /opt/librenms/config.php file. Add the following line:
$config['show _services'] =1;
You may also wish to uncomment some or all of these $config lines (so that you can scan subnets rather than add devices one at a time):
### List of RFC1918 networks to allow scanning-based discovery
#$config['nets'][] = "10.0.0.0/8";
#$config['nets'][] = "172.16.0.0/12";
$config['nets'][] = "192.168.0.0/16";
Now, we'll update the cron scheduler for the application by adding the following line to the /etc/cron.d/librenms file:
*/5 * * * * librenms /opt/librenms/services-wrapper.py 1
By default, not all the plugins are installed – in fact, in my install, none were. Install them like so:
apt-get install nagios-plugins nagios-plugins-extra
Now, we should be able to add a service. Choose Services > Add a Service in LibreNMS and monitor for SSH on our core switch (TCP port 22):
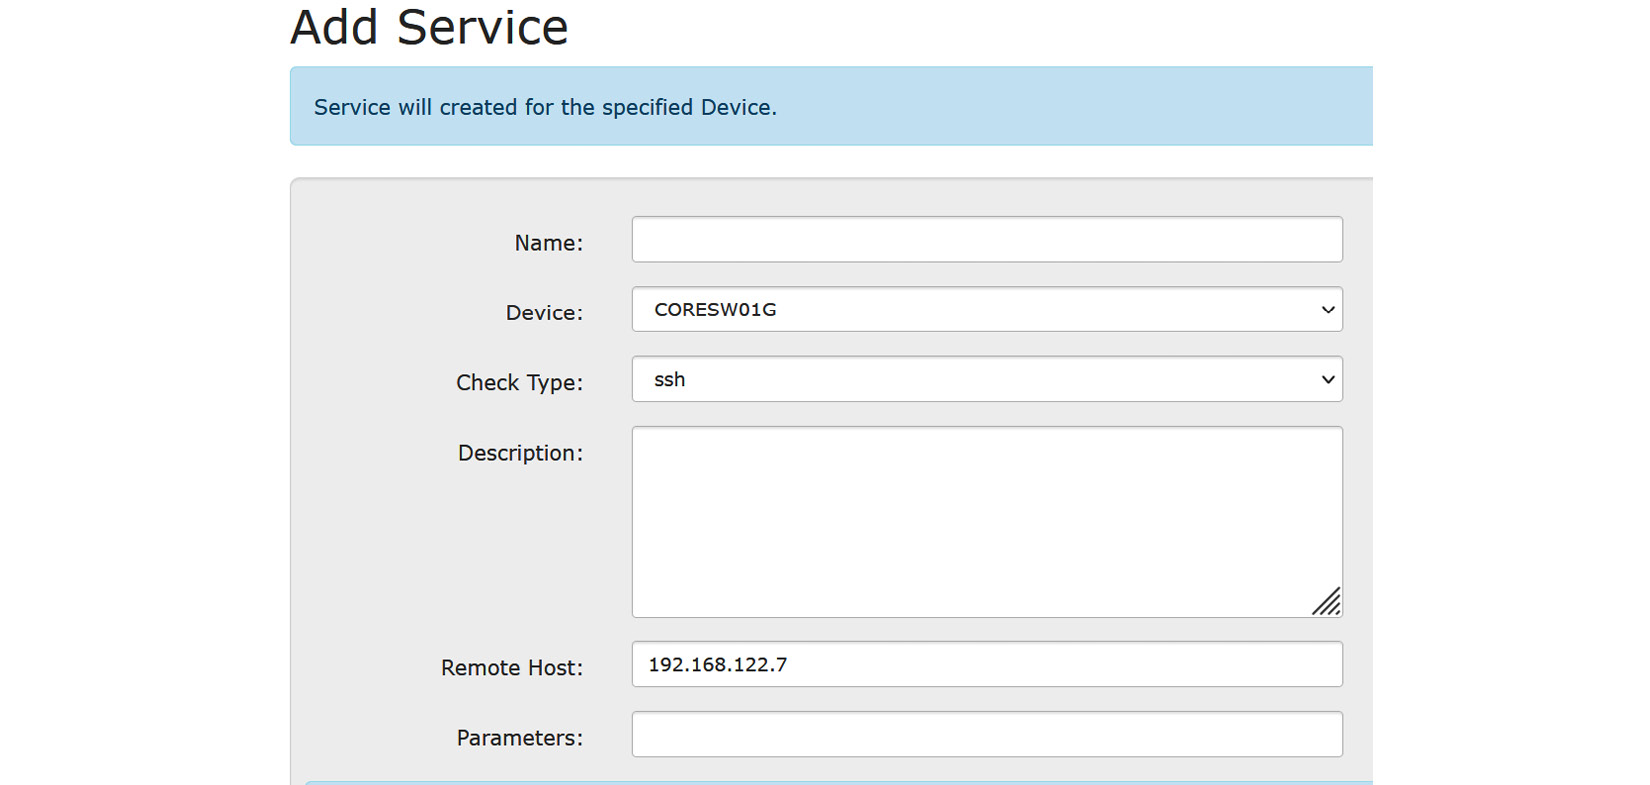
Figure 12.19 – Monitoring a basic service in LibreNMS
You can expand on this – did you notice how many service checks there were in the list when you added the first service? Let's add a monitor for an HTTP service. In this case, we'll watch it on our firewall. This is a handy check for watching an SSL VPN service as well:
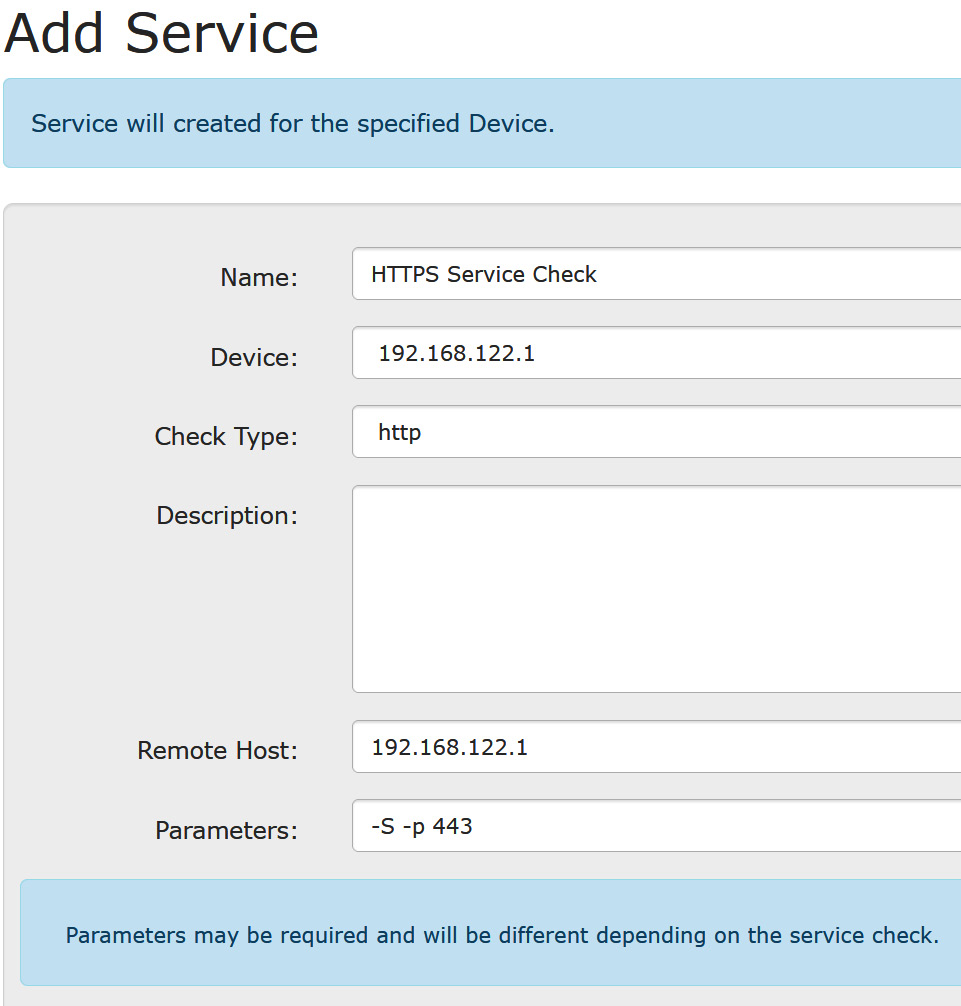
Figure 12.20 – Monitoring an HTTPS service in LibreNMS using parameters
Note that the parameters here are important. -S indicates that the check should use SSL (or more specifically, TLS). –p 443 indicates the port to poll.
Now, when we navigate to the Services page, we'll see the two services we just added. You may need to give it a few minutes for LibreNMS to get around to polling both of them:

Figure 12.21 – Services display in LibreNMS
The full list of available plugins can be seen directly from the dropdown on the Service configuration page:
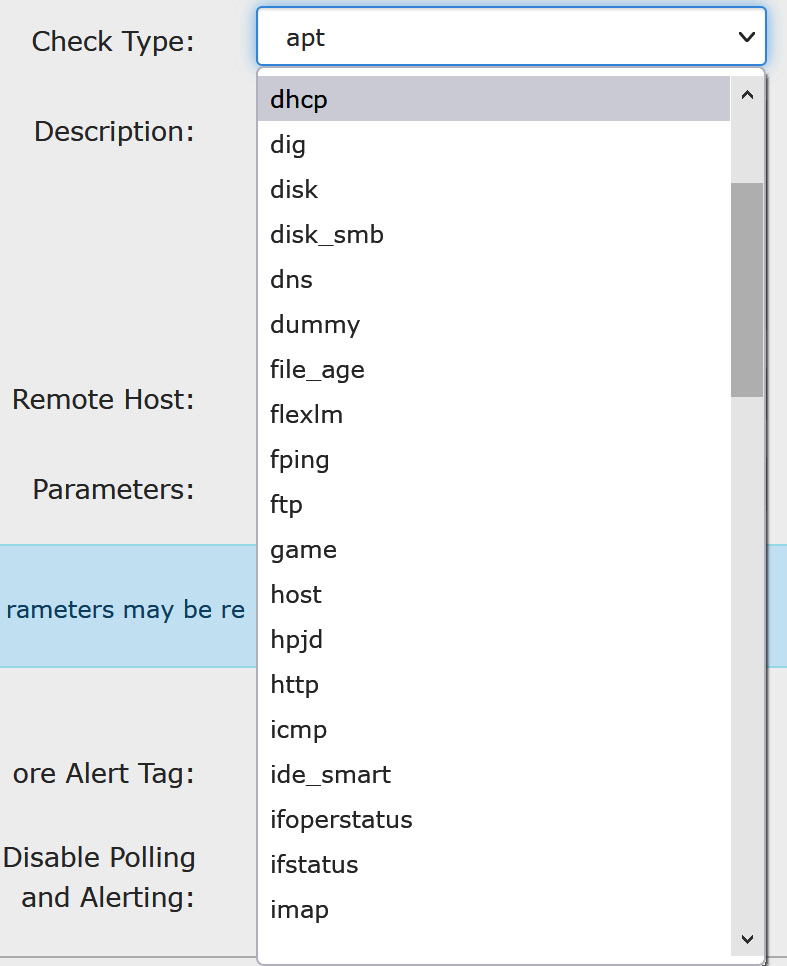
Figure 12.22 – Service checks available in LibreNMS
Some of the commonly used checks include the following:

The documentation for all the parameters for each of these checks is located at https://www.monitoring-plugins.org/doc/man/index.html.
That about covers the basic operation of the LibreNMS system. Now, let's move on to collecting and analyzing traffic. We won't be using packet captures, but rather aggregating the high-level traffic information into "flows" using the family of NetFlow protocols.


