Debugging
All families of ESP32 MCUs support Joint Test Action Group (JTAG) debugging. ESP-IDF makes use of OpenOCD, an open-source software, to interface with the JTAG probe/adapter, such as an ESP-Prog debugger. To debug our applications, we use an Espressif version of gdb (the GNU debugger), depending on the architecture of ESP32 that we have in a particular project. The next figure shows a general ESP32 debug setup:

Figure 2.24: JTAG debugging
When we develop our own custom ESP32 devices, we can connect to the standard JTAG interface of ESP32 to debug the application. With this option, we need to use a JTAG probe between the development machine and the custom ESP32 device. The JTAG pins are listed on the official documentation for each family of ESP32 (https://docs.espressif.com/projects/esp-idf/en/latest/esp32/api-guides/jtag-debugging/configure-other-jtag.html).
The issue with JTAG debugging is that it requires at least 4 GPIO pins to carry the JTAG signals, which means 4 GPIO pins less available to your application. This might be a problem in some projects where you need more GPIO pins. To address this issue, Espressif introduces direct USB debugging (built-in JTAG) without a JTAG probe. In the preceding figure, the JTAG probe in the middle is not needed for debugging and OpenOCD running on the development machine talks directly to the MCU over USB. The built-in JTAG debugging requires only two pins on ESP32, which saves two pins compared to the ordinary JTAG debugging with a probe. This feature is not available in all ESP32 families but ESP32-C3 and ESP32-S3 do have it; thus, we will prefer this method in this example with our ESP32-S3-BOX-Lite devkit. We don’t need a JTAG probe but we still need a USB cable with the pins exposed outside to be able to connect them to the corresponding pins of the devkit. The connections are:
ESP32-S3 Pin    USB Signal
GPIO19            D-
GPIO20            D+
5V                V_BUS
GND            Ground
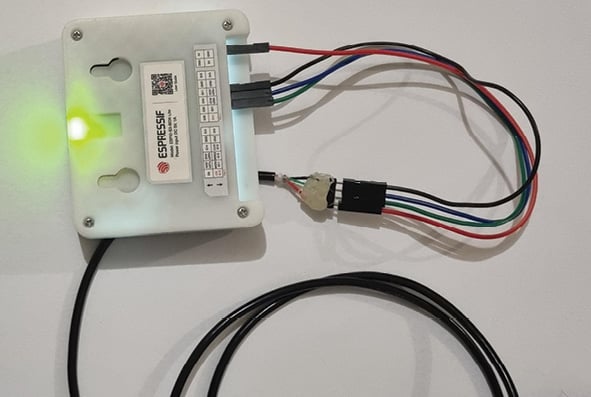
We can find a USB cable on many online shops with all lines exposed but it is perfectly fine to cut a USB cable and solder a 4-pin header to use its pins. You can see my simple setup below:

Figure 2.25: Built-in JTAG
We don’t need a driver for Linux or macOS to use the built-in JTAG debugging. The Windows driver comes with the ESP-IDF Tools Installer (https://docs.espressif.com/projects/esp-idf/en/latest/esp32s3/get-started/windows-setup.html#esp-idf-tools-installer).
Now, it is time to create the project and upload the firmware to see whether our setup works. In this example, we will see another way of creating an ESP-IDF project. We will work in the ESP-IDF environment from the command line and use the idf.py script to create the project and for other project tasks. Let’s do this in steps:
- If you are a Windows user, run the ESP-IDF Command Prompt shortcut from the Windows Start menu. It will open a command-line terminal with the ESP-IDF environment. If your development platform is Linux or macOS, start a terminal and run the
export.shorexport.fishscripts respectively to have the ESP-IDF environment in the terminal:$ source ~/esp/esp-idf/export.sh Detecting the Python interpreter Checking "python" ... Python 3.10.11 "python" has been detected Adding ESP-IDF tools to PATH… <more logs> Done! You can now compile ESP-IDF projects. Go to the project directory and run: idf.py build - Test the
idf.pyscript by running it without any arguments. It will print the help message:$ idf.py Usage: idf.py [OPTIONS] COMMAND1 [ARGS]... [COMMAND2 [ARGS]...]... ESP-IDF CLI build management tool. For commands that are not known to idf.py an attempt to execute it as a build system target will be made. <rest of the help message> - Go to your project directory and run
idf.pywith a new project name. The script will create an ESP-IDF project with that name in a directory with the same name:$ idf.py create-project debugging_ex Executing action: create-project The project was created in <your project directory>/debugging_ex $ ls debugging_ex $ cd debugging_ex/ $ tree . ├── CMakeLists.txt └── main ├──CMakeLists.txt └── debugging_ex.c 1 directory, 3 files - Download the
sdkconfigfile from the book repository into the project directory. It can be found here: https://github.com/PacktPublishing/Developing-IoT-Projects-with-ESP32-2nd-edition/blob/main/ch2/debugging_ex/sdkconfig. - Run VSCode and open the
debugging_exdirectory. - In the VSCode IDE, rename
main/main.ctomain/main.cppand edit it to have the following code inside:#include "freertos/FreeRTOS.h" #include "freertos/task.h" void my_func(void) { int j = 0; ++j; } extern "C" void app_main() { int i = 0; while (1) { vTaskDelay(pdMS_TO_TICKS(1000)); ++i; my_func(); } } - Update the
main/CMakeLists.txtfile with the following content:idf_component_register(SRCS "debugging_ex.cpp" INCLUDE_DIRS ".") - After these changes, we should have the following directory structure:
$ tree . ├── CMakeLists.txt ├── main │ ├── CMakeLists.txt │ └── debugging_ex.cpp └── sdkconfig 1 directory, 4 files - We need to enable the debug options in the root
CMakeLists.txtfile. Edit it and set its content as the following:cmake_minimum_required(VERSION 3.16.0) include($ENV{IDF_PATH}/tools/cmake/project.cmake) project(debugging_ex) idf_build_set_property(COMPILE_OPTIONS "-O0" "-ggdb3" "-g3" APPEND) - In the terminal, build the application by running
idf.py:$ idf.py build Executing action: all (aliases: build) <more logs> Creating esp32s3 image... Merged 2 ELF sections Successfully created esp32s3 image. <more logs> - See that the
idf.pyscript has generated the application binary under the build directory:$ ls build/*.bin build/debugging_ex.bin - Run the following command to see the basic size information of the application:
$ idf.py size <some logs> Total sizes: Used static IRAM: 87430 bytes ( 274810 remain, 24.1% used) .text size: 86403 bytes .vectors size: 1027 bytes Used stat D/IRAM: 13941 bytes ( 158987 remain, 8.1% used) .data size: 11389 bytes .bss size: 2552 bytes Used Flash size : 153979 bytes .text : 113547 bytes .rodata : 40176 bytes Total image size: 252798 bytes (.bin may be padded larger) - Flash the application on the devkit (if flashing fails with a port error, just reverse the D+/D- connections of the devkit. This simple change will probably solve the problem):
$ idf.py flash Executing action: flash Serial port /dev/ttyACM0 Connecting... Detecting chip type... ESP32-S3 <more logs> Leaving... Hard resetting via RTS pin... Done - We now have an application running on the devkit, ready for debugging. Run a GDB server with the following command (
idf.pywill start anOpenOCDprocess for this):$ idf.py openocd --openocd-commands "-f board/esp32s3-builtin.cfg" Executing action: openocd OpenOCD started as a background task 477341 Executing action: post_debug Open On-Chip Debugger v0.11.0-esp32-20221026 (2022-10-26-14:47) Licensed under GNU GPL v2 <more logs> - Start another ESP-IDF command-line terminal as we did in step 1 and change the current directory to the project root directory.
- Run the following command to start a GDB client. It will open a web-based GUI in your default browser:
$ idf.py gdbgui
Executing action: gdbgui
gdbgui started as a background task 476131
The idf.py script is the single point of contact to manage an ESP-IDF project. We can create, build, flash, and debug an application by only using this script. It has more features and we will have many chances to learn and practice those features throughout the book. The ESP-IDF build system documentation provides detailed information about the idf.py script and how it works with cmake to collect all the project components to compile them into an application. Here is the link for the documentation: https://docs.espressif.com/projects/esp-idf/en/v4.4.4/esp32s3/api-guides/build-system.html.
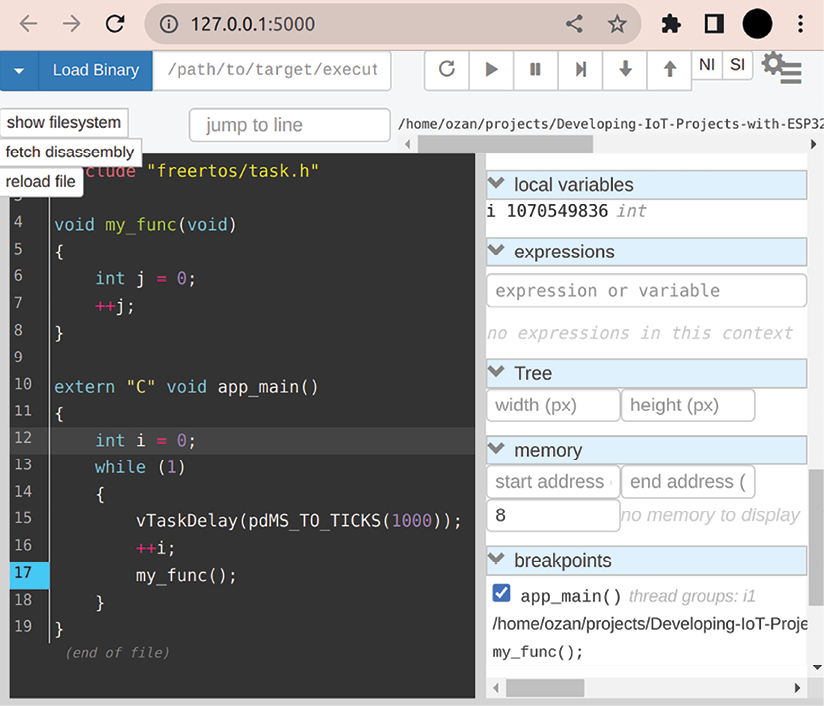
With a debugging session ready on the web GUI, we can now debug the application. The following screenshot shows this GUI.

Figure 2.26: Web-based debugger
The left panel shows the source code that is being debugged. We can set/remove breakpoints by clicking on the row numbers. The right panel shows the current status of the application, including threads, variables, memory, etc. On the top right, the buttons for the debug functions (restart, pause, continue, and step in/out/over) are placed. The debug functions also have keyboard shortcuts to ease the debugging process. Try the following debugging tasks on the GUI:
- Click on line number 17 to set a breakpoint.
- Press C (continue) on the keyboard and observe that the local variable
iincreases every time the execution hits the breakpoint. - Try pressing N (next) to run each of the lines consecutively.
- When the execution comes to
my_func, press S (step in) to enter the function. You can exit the function by pressing U (up).
This GUI is enough for an average debugging session and can be used to observe the behavior of the application when necessary. If you need to access other gdb commands, there is also another panel at the bottom where you can type these commands.


