Search icon CANCEL
Subscription
0
Cart icon
Your Cart (0 item)
Close icon
You have no products in your basket yet
Arrow left icon
Explore Products
Best Sellers
New Releases
Books
Videos
Audiobooks
Learning Hub
Conferences
Free Learning
Arrow right icon
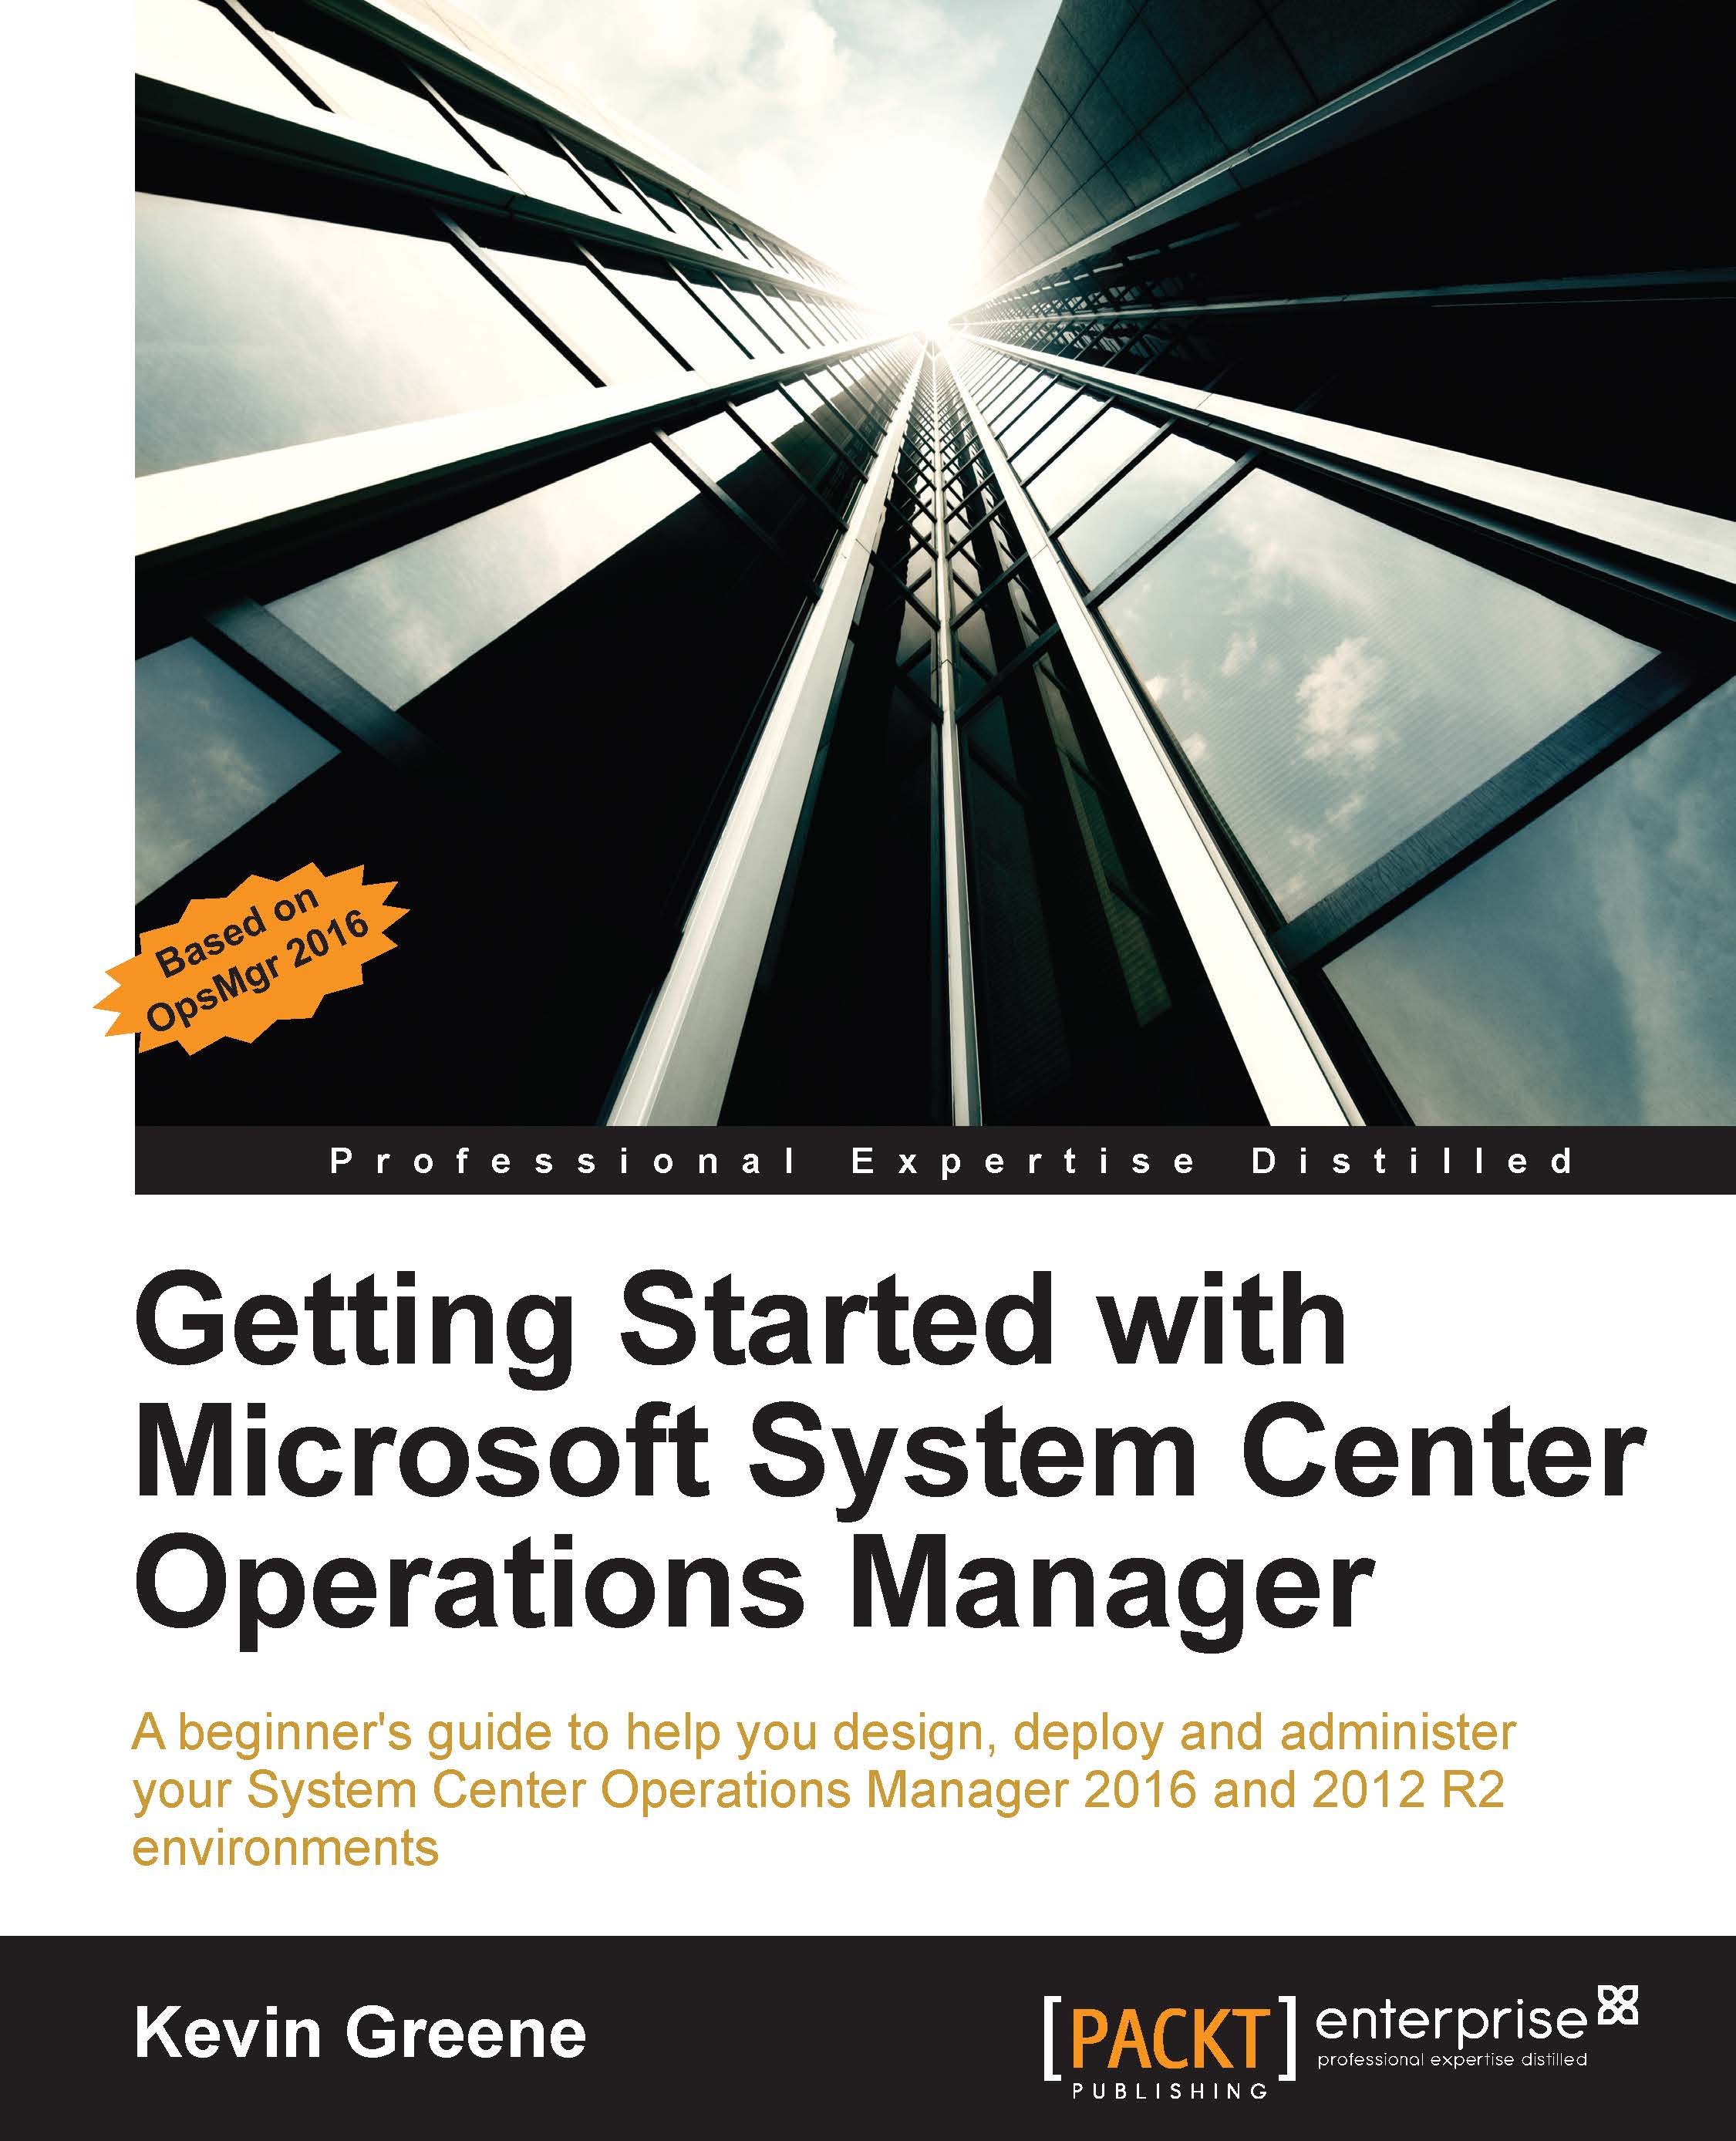
Getting Started with Microsoft System Center Operations Manager

Getting Started with Microsoft System Center Operations Manager: Using SCOM 2016 TP 5

eBook
€8.99 €39.99
Paperback
€49.99
Subscription
Free Trial
Renews at €18.99p/m

What do you get with Print?

Product feature icon Instant access to your digital eBook copy whilst your Print order is Shipped
Product feature icon Paperback book shipped to your preferred address
Product feature icon Download this book in EPUB and PDF formats
Product feature icon Access this title in our online reader with advanced features
Product feature icon DRM FREE - Read whenever, wherever and however you want
OR
Modal Close icon
Payment Processing...
tick Completed

Shipping Address

Billing Address

Shipping Methods
Table of content icon View table of contents Preview book icon Preview Book

Getting Started with Microsoft System Center Operations Manager

Chapter 1. Introduction to System Center Operations Manager

Thank you for purchasing this book and we hope that it will help you through your journey of getting started with System Center Operations Manager. In this chapter, we will give you an overview of System Center and introduce you to Operations Manager, its capabilities and the minimum system requirements that you need to have in place before you begin deployment.

The following topics will be covered in this chapter:

  • Overview of System Center
  • Introduction to Operations Manager
  • IT as a Service
  • Operations Manager core features
  • Minimum installation requirements

System Center overview

System Center is a suite of enterprise cloud and datacenter management tools from Microsoft, developed and structured on the Microsoft Operations Framework (MOF) and IT Infrastructure Library (ITIL) framework. The concept behind MOF and ITIL is to deliver IT service excellence for your organization through a process-driven guidance and team structure. You can learn more about MOF by referring to http://tinyurl.com/mofintro and for ITIL you can refer to http://tinyurl.com/itilintro.

The goal of System Center is to help deliver centralized monitoring and management of your applications, virtual environments, physical environments, and cloud-based workloads.

Operations Manager is one of the most popular components of System Center and before we dive into that, let's take a look at some of the other components in the suite:

  • Virtual Machine Manager: This is used for the centralized management of your physical and virtual IT infrastructure. Although it was primarily designed for Microsoft Hyper-V, it can also manage VMware ESX hosts and their associated virtual machines. Using the library feature, you can create virtual machines and service templates to support the fast provisioning of resources in the datacenter.
  • Data Protection Manager: Used for backing up and recovering your data, this is a best of breed tool for protecting Microsoft workloads such as SQL, Exchange, SharePoint, and Hyper-V. It also has native site-to-site replication and cloud backup options for disaster recovery scenarios.
  • Configuration Manager: This is a unified infrastructure that provides a central console from which to push out updates, deploy applications and operating system packages, and even manage your anti-virus. You can use this to ensure that the corporate compliance and control of servers, PCs and mobile devices is maintained.
  • Service Manager: This is deployed as a platform to manage your corporate ITIL-based processes and to ensure that an acceptable standard of IT compliance is achieved. Manage incident and problem resolution, change control and configuration management through the use of a central configuration management database (CMDB).
  • Orchestrator: Through the use of workflows to automate tasks, you can use this tool to manage any manual tasks that you or your IT team need to carry out on a regular basis, such as new employee account creation, virtual machine provisioning, and alert remediation. Orchestrator is also at the heart of the integration story of the other System Center suite components.

A few years back, in early 2012, Microsoft announced a major change in how they licensed and supported System Center. This new change meant that customers could no longer license an individual component from the System Center suite (there were eight components to choose from at the time); instead, the license model changed to view the whole of System Center as a single product. The thinking behind this shift wasn't to simply make more money from a higher license cost but to position System Center as a fully integrated cloud and datacenter management solution, where each of its components can be interconnected to deliver an enterprise-grade IT Service Management offering.

Introducing Operations Manager

Now that you have an understanding of the other key components of System Center, it's time to introduce you to Operations Manager (OpsMgr)—the core monitoring solution from Microsoft for over a decade. OpsMgr built its reputation in infrastructure monitoring of Microsoft workloads before expanding its capabilities to cover cross-platform monitoring of Unix/Linux distributions. The first OpsMgr 2012 release branched out to include monitoring of physical network devices as well as cloud and fabric environments, through its integration with Virtual Machine Manager and Microsoft Azure.

On top of all this, Microsoft has given us the opportunity to truly deliver full 360 degree monitoring of our applications by modeling them as IT services in OpsMgr and gaining code-level visibility with Application Performance Monitoring (APM). With OpsMgr 2012 R2 and the release of OpsMgr 2016, we get deep integration into Microsoft's cloud-based Operations Management Suite (OMS) - which gives us enhanced capabilities for log analytics, alert remediation and best practice recommendations.

If you have a requirement to report back to senior management in your organization on how available your IT services are, then OpsMgr has that covered too. Service Level Agreements (SLAs) can be tracked and reported on easily to determine the overall level of SLA compliance.

Tip

With everything that OpsMgr can do, if you find yourself constantly troubleshooting issues in your environment or not knowing where to start looking when a problem arises, then this will be a formidable tool to add to your box of tricks.

IT as a Service explained

Here's a scenario that might sound familiar, it's Friday afternoon (because these things always seem to happen before you clock off for the weekend), an end-user in your organization notifies you of an outage to an application and it's the first time you've heard of the incident.

Suddenly, you find yourself scrambling to find a solution to the application outage by trawling through the many e-mail alerts that your monitoring tool has kindly filled your inbox with and you're not even sure where to begin. Then your boss starts demanding to know when exactly everything will be back up and running again.

Finally, it's close to midnight and everyone's gone home except you. You've eliminated most of the noisy alerts in your inbox and narrowed the problem down to a bunch of alerts referring to network connectivity. Eventually, you find the network cable that the new junior admin earlier mistakenly disconnected from one of the many switches you manage in the datacenter! Once the cable is plugged back in, everything comes back online and you get to start your weekend.

This is a classic example of reactive monitoring—wherein, even though you had a monitoring tool in place, due to the constant stream of alerts you've been receiving, you missed the alert about the cable being disconnected and only reacted after the end-user logged an application outage incident. Even if you had picked up the network connectivity alert, there's still a good chance that you don't understand the overall impact of it on the business and it might not even be considered to be a valid reason for end-users complaining about their application outages.

What you really need in this situation is a monitoring solution that can bring all of the related components of an application together in the form of an IT service to help reduce your Mean Time to Resolution (MTTR), which translates to you resolving incidents quicker and keeping your end-users happy.

This is where OpsMgr comes in very useful. With OpsMgr, you can create comprehensive maps of your IT services based on your IT service catalog. With your IT services mapped out, you can then begin to understand all the components that make up each service.

If we apply this strategy to our example scenario, the next time someone disconnects a network cable, red lights will start to appear on a dashboard monitoring the IT service. It then becomes very easy to quickly identify the root cause of the outage. In Figure 1.1, you can see an example of an IT service modeled in OpsMgr that has been affected by someone disconnecting a cable from a network device.

IT as a Service explained

Figure 1.1: The Operations Console

Adopting a similar monitoring strategy will enable you to focus on the IT services that run your business from a holistic management perspective, instead of on an individual component-by-component basis. This model is defined as IT as a Service (ITaaS).

Note

Using ITaaS you can manage your services in the same way that your end-users consume them—essentially viewing each complex IT service as a single entity with a green, amber, or red health state, similar to a traffic light status!

As you progress through this book, you will learn more about how to use the ITaaS model. This will not only help you reduce the amount of time you spend trying to identify the root cause of problems, but it will facilitate you to move closer to delivering a proactive monitoring approach for all your IT services and one where you can catch possible incidents before they become bigger problems.

Operations Manager core features

In this section, we will cover some of the most common features used in OpsMgr. It's important that you have a high-level understanding of these features before installing OpsMgr. This will assist you during the planning and design phase of your deployment.

Management group

Created during the initial installation of OpsMgr, a management group is a unique logical administrative unit that defines the security boundaries of your monitoring environment.

When choosing a management group name, you must ensure that the name is unique within your Active Directory forest and also understand that whatever name you choose, it's case sensitive. It's also recommended that you refrain from using any unsupported special characters in the name and stick with letters and numbers.

You can have multiple management groups running concurrently in the same domain without a problem (this is useful for pre-production and production environments) and all configuration changes and customizations that you make will be contained inside each unique group.

Operational database

A SQL database that forms the central component of every Management Group, the Operational database installs with a default name of OperationsManager. It contains all your OpsMgr customizations along with configuration and monitoring data for all managed objects. A dedicated Operational database is required for every OpsMgr management group you deploy.

Data is retained in the Operational database by default for seven days - think of this as OpsMgr's short-term memory store. This retention period can be modified for different types of datasets by configuring database grooming within the Operations console.

Data Warehouse database

The data warehouse is a SQL database that can be either dedicated or shared by an OpsMgr management group. This database has a default installation name of OperationsManagerDW.

All historical alerting and monitoring data is stored here and with retention period of up to four-hundred days, this can be considered OpsMgr's long-term memory store. Having the ability to retain data for such a long period means OpsMgr can use the data warehouse to generate rich reports that will help you to better understand the availability and performance of your IT services.

RMS Emulator

Installed by default onto the first management server that you deploy, the Root Management Server (RMS) Emulator exists to support backward compatibility with legacy OpsMgr management packs that specifically target the RMS role. If there are no legacy management packs that contain rules targeted at the RMS role, then essentially, the RMS Emulator is not required and all management servers are considered equal.

In early releases of OpsMgr, the RMS role was arguably the most important role within the management group and unless you deployed Failover Clustering across two servers, it was also a single-point of failure. Since OpsMgr 2012, the single-point of failure RMS role was removed and out-of-box high availability was made possible using a new feature called Resource Pools. These pools are a collection of management servers that distribute the workload and ensure that monitoring continues in the event of a management server failing.

Tip

Using the Operations Manager Shell (which is the PowerShell module that gets deployed during the installation of OpsMgr), you can easily move the RMS Emulator role between management servers using the following line of code:

Get-SCOMManagementServer -Name "opsmgr1.yourdomain.com" | Set-SCOMRMSEmulator

Management Server

The Management Server role is responsible for managing and communicating with agents, maintaining management group configuration, communicating with the OpsMgr SQL databases, and facilitating console connections.

After installation of this role, you will find five new Windows services installed on your server. Out of the five services, three are configured with a service start up type of Automatic and two of them are set to Disabled.

These management server services and their startup types are detailed in the following table:

Service name

Startup type

Description

Microsoft Monitoring Agent

Automatic

  • Monitors the health of your computers.
  • Responsible for executing modules called workflows to support different monitoring scenarios.
  • Listens on TCP port 5723.
  • Also known as the 'HealthService'.

System Center Data Access

Automatic

  • This runs on all management servers.
  • Handles communications with the OpsMgr consoles and Report servers.
  • It reads and writes data to the OpsMgr databases on behalf of workflows running on agents and gateway servers.
  • It listens on TCP port 5724.
  • It's also known as the 'SDK' service.

System Center Management Configuration

Automatic

  • This runs on all management servers.
  • It monitors configuration changes within the management group and passes any updated changes to agents.
  • It's also known as the 'Configuration' service.

Microsoft Monitoring Agent Audit Forwarding

Disabled

  • This is installed on all management servers, gateway servers and agents but disabled by default.
  • It's used with the Audit Collection Services (ACS) feature of OpsMgr.
  • It sends security event logs to an ACS collector server.

Microsoft Monitoring Agent APM

Disabled

  • This is installed on all management servers, gateway servers and agents but is disabled by default.
  • It's used with the Application Performance Monitoring (APM) feature of OpsMgr to monitor code-level health of .NET applications.

Reporting Server

The OpsMgr Reporting Server role integrates with SQL Server Reporting Services (SSRS) and gives you the ability to generate and schedule reports from an intuitive user interface inside the Operations Console. You can choose from ready-made reports that come bundled with the various management packs you deploy or you can generate your own custom reports using some of the generic templates on offer.

Good reporting enables you to visualize the monitoring data generated from your IT infrastructure and provide exactly the kind of high-level information that senior management teams request on a regular basis. You also have the option to e-mail reports on a specific schedule or simply export them into various easy-to-read formats, such as Word, Excel, PDF, CSV, and TIFF to name a few.

Gateway Server

The primary role of a Gateway Server is to act as a go-between for monitored agents that are located in untrusted domains and networks - DMZ's are a great example of where to use this role in your environment.

When located in an untrusted domain, a Gateway Server must use certificates to authenticate with the main OpsMgr environment. It communicates with management servers over TCP port 5723 and cannot connect directly to the OpsMgr databases.

A Gateway Server also acts as a data compressor and can be used to compress monitoring traffic from agents to the management servers by up to 50% in certain scenarios.

Agents

The OpsMgr agent is used for server and client monitoring of Windows and Unix/Linux operating systems. A push installation can be initiated from management servers and gateway servers to make the deployment nice and easy. It can also be deployed manually or added into computer images and packaged as an application for deployment with a tool such as System Center Configuration Manager.

On a Windows computer, after the agent has been installed, three new windows services are created. These new services and their startup types are detailed in the following table:

Service Name

Startup Type

Description

Microsoft Monitoring Agent

Automatic

  • Monitors the health of your computers
  • Responsible for executing workflow modules and scripts to support different monitoring scenarios
  • Listens on TCP port 5723
  • Also known as the 'HealthService'

Microsoft Monitoring Agent Audit Forwarding

Disabled

  • Installed on all management servers, gateway servers and agents but is disabled by default
  • Used with the Audit Collection Services (ACS) feature of OpsMgr
  • Sends security event logs to an ACS collector server

Microsoft Monitoring Agent APM

Disabled

  • Installed on all management servers, gateway servers and agents but is disabled by default
  • Used with the Application Performance Monitoring (APM) feature of OpsMgr to monitor code-level health of .NET applications

The agent's job is to communicate with management and gateway servers, discover objects, execute workflows, and run diagnostic tasks on monitored computers.

If you have deployed multiple management groups, the OpsMgr agent can perform a feature called 'multi-homing' whereby it can communicate with up to four different management groups at any given time. This feature will be discussed in more detail in Chapter 4, Deploying Agents.

Consoles

There are a number of consoles that you can interact with when you are working with OpsMgr. The most common one is the Operations Console, which is essentially the main console that you will use when administering OpsMgr. In Figure 1.2, you can see the Operations Console in action monitoring some Windows computers.

Consoles

Figure 1.2: The Operations Console

During installation, you can choose to deploy the Web Console, which is a lighter and scaled-down version of the Operations Console. This console will be deployed as an IIS website on whichever server you choose to run it from. Although you can't perform any administration or reporting tasks here, the Web Console is useful if you want to give your OpsMgr users read-only access to the monitored environment.

Tip

The maximum recommended number of concurrent Operational Console connections per management server is limited to 50. If you go over this number, then you will encounter performance issues. The Web Console however, has no limit to the number of concurrent connections you can make.

When you deploy the Web Console role with the installation wizard, you get an automatic installation of the Application Advisor and Application Diagnostics consoles - both of which are used in conjunction with the APM feature for code-level monitoring of your applications.

Management packs

If you want to get any monitoring value at all from OpsMgr, then you are going to need to install some management packs. These are small files based on XML that can be imported into OpsMgr and which hold information about how to monitor a specific application or hardware product set.

Management packs can contain some or all of the following objects:

  • Class definitions
  • Discoveries
  • Monitors
  • Rules
  • Views
  • Knowledge
  • Reports
  • Templates

In Chapter 5, Working with Management Packs, you will learn much more about management packs and how to use them to get the most out of your OpsMgr deployment.

Application Performance Monitoring

Another optional and very useful feature of OpsMgr is Application Performance Monitoring (APM). When configured, this gives IT Operations teams the ability to help troubleshoot problems inside applications at the code-level, similar to the world of a Developer. This synergy has become known as 'DevOps', and it's something that has gained a lot of traction in the last few years.

A real benefit of deploying APM in OpsMgr is that, not only do you get to dive deep into your .NET and Java application code; you can also see the health of the underlying infrastructure that runs those applications.

Network device monitoring

If you're going to monitor the full breadth of your IT services, then you will no doubt want to include network device monitoring in your designs. With a choice of ICMP or SNMP (v1/v2c/v3) monitoring, you can take advantage of the built-in Network Node and Vicinity dashboards to give you rich visualizations on the health of your network infrastructure. Chapter 6, Managing Network Devices, will get you up and running with this feature in no time.

Audit Collection Services

Audit Collection Services (ACS) is an optional feature used to collect security event logs from monitored systems and bring them together in a central SQL database for auditing and compliance purposes. ACS uses its own SQL database (named OpsMgrAC by default), which is kept completely separate from the OperationsManager and OperationsManagerDW databases.

To enable ACS, you must deploy a management server and configure it as an ACS Collector. The ACS Collector then receives and processes the audited security event logs from targeted computers and passes that information into the OpsMgrAC database.

Specific computers running the OpsMgr agent can be targeted with ACS audit policies to enable them as an ACS Forwarder. When Windows computers are enabled as ACS Forwarders, the Microsoft Monitoring Agent Audit Forwarding service is started on those computers and configured with an 'Automatic' start up state. When this service is running, the ACS audit policies are applied and security events will be sent to the ACS Collector for auditing.

Agentless Exception Monitoring

Agentless Exception Monitoring (AEM) is an optional feature that centralizes the collection of hardware, operating system, and application crash information from selected computers. If you're familiar with the old 'Dr. Watson Debugger for Windows' tool that collects data from your computer when it crashes, then AEM is a centralized version of this which feeds the crash data into OpsMgr.

Minimum installation requirements

When the time comes to perform your first installation of OpsMgr, it's important to understand all of the minimum requirements that must be in place before you begin.

OpsMgr Sizing Helper tool

The OpsMgr Sizing Helper tool is an interactive Excel document designed to assist you with planning and sizing your deployments. As shown in Figure 1.2, you can choose from a number of different configuration scenarios and all you need to have is a rough idea of what it is that you actually need to monitor.

OpsMgr Sizing Helper tool

Figure 1.3: OpsMgr Sizing Helper Tool

This should be the go-to tool that you use prior to every OpsMgr deployment that you do. Although the information it feeds back to you is to be used purely as a guide, it goes a long way to ensure that your designs are aligned as close to best-practice recommendations as possible. You can download the tool from http://tinyurl.com/opsmgrsizing.

Virtualization support

All OpsMgr features are fully supported by Microsoft to run in a virtual environment that meets the minimum requirements outlined in the OpsMgr Sizing Helper tool. Purely for performance reasons, Microsoft recommends running the OpsMgr SQL databases on physical disks rather than on virtual disks but this is only a recommendation and there is no issue if you want to deploy the databases in a virtual environment, assuming of course, that you have configured the underlying storage where your virtual disks are located according to best practice recommendations for SQL workloads.

You also have the option of running some or your entire OpsMgr environment on Microsoft Azure for the following three recommended scenarios:

  • You run OpsMgr on a Microsoft Azure virtual machine and use it to monitor other Microsoft Azure virtual machines
  • You run OpsMgr on a Microsoft Azure virtual machine and use it to monitor instances that are not running on Microsoft Azure
  • You run OpsMgr on-premises and use it to monitor Microsoft Azure virtual machines

Database requirements

If you're running OpsMgr 2012 R2, then the following versions of SQL Server are supported to host the databases:

  • SQL Server 2014 SP1, Standard and Enterprise
  • SQL Server 2014, Standard and Enterprise
  • SQL Server 2012 SP2, Standard and Enterprise
  • SQL Server 2012 SP1, Standard and Enterprise
  • SQL Server 2012, Standard and Enterprise
  • SQL Server 2008 R2 SP2, Standard and Datacenter
  • SQL Server 2008 R2 SP1, Standard and Datacenter

If you're running OpsMgr 2016, then your SQL choice is slightly more limited:

  • SQL Server 2016, Standard and Enterprise
  • SQL Server 2014 SP1, Standard and Enterprise
  • SQL Server 2014, Standard and Enterprise
  • SQL Server 2012 SP2, Standard and Enterprise

Operating system requirements

The following operating systems are supported to run OpsMgr 2012 R2:

  • Windows Server 2012 R2, Standard and Datacenter
  • Windows Server 2012, Standard and Datacenter
  • Windows Server 2008 R2 SP2
  • Windows Server 2008 R2 SP1

OpsMgr 2016 can be deployed on these operating systems:

  • Windows Server 2016, Standard and Datacenter
  • Windows Server 2012 R2, Standard and Datacenter

Web console requirements

If you deploy the OpsMgr 2012 R2 Web Console role, the following Internet Explorer and Silverlight versions are supported:

  • Internet Explorer 8 and higher
  • Silverlight 5

The OpsMgr 2016 Web Console has the following requirements:

  • Internet Explorer 11 and higher
  • Silverlight 5

Firewall requirements

In the following table, we can see the TCP port numbers and outgoing directions that the various OpsMgr features require. This information can be useful when configuring communication across firewalls in your organization.

From feature

TCP port number and direction

To feature

Management server

1433→

Operational database

Management server

1433→

Data Warehouse database

Management server

5723,5724→

Management server

Reporting server

5723,5724→

Management server

Reporting server

1433→

Data Warehouse database

Gateway server

5723→

Management server

Operations console

5724→

Management server

Operations console (Reports)

80, 443→

SQL Reporting services

Web Console browser

51908→

Web Console server

Windows agent

5723→

Management server

Management server

135→

Windows agent

(RPC for push install)

Management server

445→

Windows agent

(SMB for push install)

Management server

139→

Windows agent

(RPC for push repair)

Management server

1270→

UNIX/Linux agent

Management server

22→

UNIX/Linux agent

(Remote management)

Connector framework source

51905→

Management server

Connected management server

(Local)

5724→

Connected management server

(Remote)

AEM data from client

51906→

Management server AEM file share

ACS collector

1433→

ACS database

ACS forwarder

51909→

Management Server ACS collector

Although the majority of firewall ports required for OpsMgr are TCP-based, the following table lists the UDP port numbers and the direction they should be enabled for:

From feature

UDP port number and direction

To feature

Management server

137→

Windows agent

(push install)

Management server

138→

Windows agent

(push install)

Management server

445→

Windows agent

(push install)

Management server

1434→

Operational database

Management server

1434→

Data Warehouse database

SNMP network device

161→

Management server

Management server

161→

SNMP network device

SNMP network device

162→

Management server

Management server

162→

SNMP network device

Windows agent requirements

If you need to deploy an OpsMgr 2012 R2 agent to your Windows estate for monitoring, then the following is a list of supported server and client operating systems:

  • Windows Server 2016
  • Windows Server 2012 R2, Windows Server 2012
  • Microsoft Hyper-V Server 2012 R2
  • Windows 2008 Server R2, Windows 2008 Server R2 SP1, Windows 2008 Server SP2
  • Windows Server 2003 SP2
  • Windows 10
  • Windows 8.1, Windows 8
  • Windows 7
  • Windows 7 Embedded
  • Windows Vista SP2
  • Windows XP Pro SP3, SP2
  • Windows XP Embedded

For OpsMgr 2016 agents, the following Windows server and client operating systems are supported:

  • Windows Server 2016
  • Windows Server 2012 R2, Windows Server 2012
  • Microsoft Hyper-V Server 2012 R2
  • Windows 2008 Server R2, Windows 2008 Server R2 SP1, Windows 2008 Server SP2
  • Windows Server 2003 SP2
  • Windows 10
  • Windows 8.1, Windows 8 
  • Windows 7
  • Windows 7 Embedded
  • Windows Vista SP2

UNIX/Linux agent requirements

A wide range of cross-platform operating systems are supported and the following list details the versions you can monitor with both OpsMgr 2012 R2 and OpsMgr 2016:

  • HP-UX 11i V3/V2 (PA-RISC and Itanium)
  • Oracle Solaris 11/10 (SPARC and x86)
  • Oracle Solaris 9 (SPARC)
  • Oracle Linux 7 (x64)
  • Oracle Linux 6/5 (x86/x64)
  • Red Hat Enterprise Linux 7 (x64)
  • Red Hat Enterprise Linux 6/5/4 (x86/x64)
  • SUSE Linux Enterprise Server 12 (x64)
  • SUSE Linux Enterprise Server 11/10 (x86/x64)
  • SUSE Linux Enterprise Server 9 (x86)
  • IBM AIX 7.1/6.1/5.3 (POWER)
  • CentOS 7 (x64)
  • CentOS 6/5 (x86/x64)
  • Debian 7/6/5 (x86/x64)
  • Ubuntu Server 14.04/12.04/10.04 (x86/x64)

Summary

In this chapter, we first learned about the System Center suite and its associated components before diving into an introduction about Operations Manager and its core features. After that, we discussed ITaaS using a real-world example to help you understand what it is.

At the end of the chapter, we introduced the OpsMgr Sizing Helper tool and provided you with information about the supported operating systems that you can run OpsMgr and its associated features on.

In the next chapter, we will show you some examples to help with the design and planning of your deployments before diving into installing OpsMgr for the first time.

Left arrow icon Right arrow icon

Key benefits

  • Discover how to monitor complex IT environments with System Center Operations Manager using tips, tricks and best practice recommendations from industry experts.
  • Learn how to create eye-catching dashboards and reports to help deliver a tangible return on investment back to your organization.
  • Optimize, troubleshoot and perform disaster recovery in Operations Manager using step by step examples based on real-world scenarios.

Description

Most modern IT environments comprise a heterogeneous mixture of servers, network devices, virtual hypervisors, storage solutions, cross-platform operating systems and applications. All this complexity brings a requirement to deliver a centralized monitoring and reporting solution that can help IT administrators quickly identify where the problems are and how best to resolve them. Using System Center Operations Manager (OpsMgr), administrators get a full monitoring overview of the IT services they have responsibility for across the organization - along with some useful management capabilities to help them remediate any issues they've been alerted to. This book begins with an introduction to OpsMgr and its core concepts and then walks you through designing and deploying the various roles. After a chapter on exploring the consoles, you will learn how to deploy agents, work with management packs, configure network monitoring and model your IT services using distributed applications. There’s a chapter dedicated to alert tuning and another that demonstrates how to visualize your IT using dashboards. The final chapters in the book discuss how to create alert subscriptions, manage reports, backup and recover OpsMgr, perform maintenance and troubleshoot common problems.

Who is this book for?

The target audience for this book is the IT Pro or System Administrator who wants to deploy and use System Center Operations Manager but has no previous knowledge of the product. As a ‘Getting Started’ book, our primary objective is to equip you with the knowledge you need to feel comfortable when working with common monitoring scenarios in OpsMgr. With this in mind, deep-diving into less-common OpsMgr features such as Audit Collection Services (ACS), Agentless Exception Monitoring (AEM) and Application Performance Monitoring (APM) has been intentionally omitted.

What you will learn

  • Install a new System Center 2016 Operations Manager Management Group
  • Design and provision custom views to relevant support teams.
  • Understand how to deploy agents
  • Work with management packs
  • Monitor network devices
  • Model your IT services with distributed applications
  • Create dashboards and custom visualizations
  • Tune, optimize, maintain and troubleshoot System Center Operations Manager
Estimated delivery fee Deliver to Slovenia

Premium delivery 7 - 10 business days

€25.95
(Includes tracking information)

Product Details

Country selected
Publication date, Length, Edition, Language, ISBN-13
Publication date : Jun 30, 2016
Length: 560 pages
Edition : 1st
Language : English
ISBN-13 : 9781785289743
Vendor :
Microsoft
Tools :

What do you get with Print?

Product feature icon Instant access to your digital eBook copy whilst your Print order is Shipped
Product feature icon Paperback book shipped to your preferred address
Product feature icon Download this book in EPUB and PDF formats
Product feature icon Access this title in our online reader with advanced features
Product feature icon DRM FREE - Read whenever, wherever and however you want
OR
Modal Close icon
Payment Processing...
tick Completed

Shipping Address

Billing Address

Shipping Methods
Estimated delivery fee Deliver to Slovenia

Premium delivery 7 - 10 business days

€25.95
(Includes tracking information)

Product Details

Publication date : Jun 30, 2016
Length: 560 pages
Edition : 1st
Language : English
ISBN-13 : 9781785289743
Vendor :
Microsoft
Tools :

Packt Subscriptions

See our plans and pricing
Modal Close icon
€18.99 billed monthly
Feature tick icon Unlimited access to Packt's library of 7,000+ practical books and videos
Feature tick icon Constantly refreshed with 50+ new titles a month
Feature tick icon Exclusive Early access to books as they're written
Feature tick icon Solve problems while you work with advanced search and reference features
Feature tick icon Offline reading on the mobile app
Feature tick icon Simple pricing, no contract
€189.99 billed annually
Feature tick icon Unlimited access to Packt's library of 7,000+ practical books and videos
Feature tick icon Constantly refreshed with 50+ new titles a month
Feature tick icon Exclusive Early access to books as they're written
Feature tick icon Solve problems while you work with advanced search and reference features
Feature tick icon Offline reading on the mobile app
Feature tick icon Choose a DRM-free eBook or Video every month to keep
Feature tick icon PLUS own as many other DRM-free eBooks or Videos as you like for just €5 each
Feature tick icon Exclusive print discounts
€264.99 billed in 18 months
Feature tick icon Unlimited access to Packt's library of 7,000+ practical books and videos
Feature tick icon Constantly refreshed with 50+ new titles a month
Feature tick icon Exclusive Early access to books as they're written
Feature tick icon Solve problems while you work with advanced search and reference features
Feature tick icon Offline reading on the mobile app
Feature tick icon Choose a DRM-free eBook or Video every month to keep
Feature tick icon PLUS own as many other DRM-free eBooks or Videos as you like for just €5 each
Feature tick icon Exclusive print discounts

Frequently bought together


Stars icon
Total 149.97
Microsoft System Center 2016 Service Manager Cookbook
€49.99
Getting Started with Microsoft System Center Operations Manager
€49.99
Microsoft System Center 2016 Orchestrator Cookbook
€49.99
Total 149.97 Stars icon
Banner background image

Table of Contents

12 Chapters
1. Introduction to System Center Operations Manager Chevron down icon Chevron up icon
2. Installing System Center Operations Manager Chevron down icon Chevron up icon
3. Exploring the Consoles Chevron down icon Chevron up icon
4. Deploying Agents Chevron down icon Chevron up icon
5. Working with Management Packs Chevron down icon Chevron up icon
6. Managing Network Devices Chevron down icon Chevron up icon
7. Configuring Service Models with Distributed Applications Chevron down icon Chevron up icon
8. Alert Tuning the Easy Way Chevron down icon Chevron up icon
9. Visualizing Your IT with Dashboards Chevron down icon Chevron up icon
10. Creating Alert Subscriptions and Reports Chevron down icon Chevron up icon
11. Backing Up, Maintenance and Troubleshooting Chevron down icon Chevron up icon
Index Chevron down icon Chevron up icon

Customer reviews

Rating distribution
Full star icon Full star icon Full star icon Full star icon Full star icon 5
(4 Ratings)
5 star 100%
4 star 0%
3 star 0%
2 star 0%
1 star 0%
sneh Sep 08, 2017
Full star icon Full star icon Full star icon Full star icon Full star icon 5
Simple and effective language and deep coverage of concept
Amazon Verified review Amazon
Jakapong Dec 05, 2017
Full star icon Full star icon Full star icon Full star icon Full star icon 5
I had zero knowledge with SCOM. However, the book contents help me a lot in my works. Very nice book!
Amazon Verified review Amazon
Riyaas Jul 10, 2018
Full star icon Full star icon Full star icon Full star icon Full star icon 5
good,useful
Amazon Verified review Amazon
Amazon Kunde Mar 01, 2022
Full star icon Full star icon Full star icon Full star icon Full star icon 5
I used this book for my thesis. It was really helpful and also easy written for rookies. Good leading during installation and also some good hints to solve problems.
Amazon Verified review Amazon
Get free access to Packt library with over 7500+ books and video courses for 7 days!
Start Free Trial

FAQs

What is the delivery time and cost of print book? Chevron down icon Chevron up icon

Shipping Details

USA:

'

Economy: Delivery to most addresses in the US within 10-15 business days

Premium: Trackable Delivery to most addresses in the US within 3-8 business days

UK:

Economy: Delivery to most addresses in the U.K. within 7-9 business days.
Shipments are not trackable

Premium: Trackable delivery to most addresses in the U.K. within 3-4 business days!
Add one extra business day for deliveries to Northern Ireland and Scottish Highlands and islands

EU:

Premium: Trackable delivery to most EU destinations within 4-9 business days.

Australia:

Economy: Can deliver to P. O. Boxes and private residences.
Trackable service with delivery to addresses in Australia only.
Delivery time ranges from 7-9 business days for VIC and 8-10 business days for Interstate metro
Delivery time is up to 15 business days for remote areas of WA, NT & QLD.

Premium: Delivery to addresses in Australia only
Trackable delivery to most P. O. Boxes and private residences in Australia within 4-5 days based on the distance to a destination following dispatch.

India:

Premium: Delivery to most Indian addresses within 5-6 business days

Rest of the World:

Premium: Countries in the American continent: Trackable delivery to most countries within 4-7 business days

Asia:

Premium: Delivery to most Asian addresses within 5-9 business days

Disclaimer:
All orders received before 5 PM U.K time would start printing from the next business day. So the estimated delivery times start from the next day as well. Orders received after 5 PM U.K time (in our internal systems) on a business day or anytime on the weekend will begin printing the second to next business day. For example, an order placed at 11 AM today will begin printing tomorrow, whereas an order placed at 9 PM tonight will begin printing the day after tomorrow.


Unfortunately, due to several restrictions, we are unable to ship to the following countries:

  1. Afghanistan
  2. American Samoa
  3. Belarus
  4. Brunei Darussalam
  5. Central African Republic
  6. The Democratic Republic of Congo
  7. Eritrea
  8. Guinea-bissau
  9. Iran
  10. Lebanon
  11. Libiya Arab Jamahriya
  12. Somalia
  13. Sudan
  14. Russian Federation
  15. Syrian Arab Republic
  16. Ukraine
  17. Venezuela
What is custom duty/charge? Chevron down icon Chevron up icon

Customs duty are charges levied on goods when they cross international borders. It is a tax that is imposed on imported goods. These duties are charged by special authorities and bodies created by local governments and are meant to protect local industries, economies, and businesses.

Do I have to pay customs charges for the print book order? Chevron down icon Chevron up icon

The orders shipped to the countries that are listed under EU27 will not bear custom charges. They are paid by Packt as part of the order.

List of EU27 countries: www.gov.uk/eu-eea:

A custom duty or localized taxes may be applicable on the shipment and would be charged by the recipient country outside of the EU27 which should be paid by the customer and these duties are not included in the shipping charges been charged on the order.

How do I know my custom duty charges? Chevron down icon Chevron up icon

The amount of duty payable varies greatly depending on the imported goods, the country of origin and several other factors like the total invoice amount or dimensions like weight, and other such criteria applicable in your country.

For example:

  • If you live in Mexico, and the declared value of your ordered items is over $ 50, for you to receive a package, you will have to pay additional import tax of 19% which will be $ 9.50 to the courier service.
  • Whereas if you live in Turkey, and the declared value of your ordered items is over € 22, for you to receive a package, you will have to pay additional import tax of 18% which will be € 3.96 to the courier service.
How can I cancel my order? Chevron down icon Chevron up icon

Cancellation Policy for Published Printed Books:

You can cancel any order within 1 hour of placing the order. Simply contact customercare@packt.com with your order details or payment transaction id. If your order has already started the shipment process, we will do our best to stop it. However, if it is already on the way to you then when you receive it, you can contact us at customercare@packt.com using the returns and refund process.

Please understand that Packt Publishing cannot provide refunds or cancel any order except for the cases described in our Return Policy (i.e. Packt Publishing agrees to replace your printed book because it arrives damaged or material defect in book), Packt Publishing will not accept returns.

What is your returns and refunds policy? Chevron down icon Chevron up icon

Return Policy:

We want you to be happy with your purchase from Packtpub.com. We will not hassle you with returning print books to us. If the print book you receive from us is incorrect, damaged, doesn't work or is unacceptably late, please contact Customer Relations Team on customercare@packt.com with the order number and issue details as explained below:

  1. If you ordered (eBook, Video or Print Book) incorrectly or accidentally, please contact Customer Relations Team on customercare@packt.com within one hour of placing the order and we will replace/refund you the item cost.
  2. Sadly, if your eBook or Video file is faulty or a fault occurs during the eBook or Video being made available to you, i.e. during download then you should contact Customer Relations Team within 14 days of purchase on customercare@packt.com who will be able to resolve this issue for you.
  3. You will have a choice of replacement or refund of the problem items.(damaged, defective or incorrect)
  4. Once Customer Care Team confirms that you will be refunded, you should receive the refund within 10 to 12 working days.
  5. If you are only requesting a refund of one book from a multiple order, then we will refund you the appropriate single item.
  6. Where the items were shipped under a free shipping offer, there will be no shipping costs to refund.

On the off chance your printed book arrives damaged, with book material defect, contact our Customer Relation Team on customercare@packt.com within 14 days of receipt of the book with appropriate evidence of damage and we will work with you to secure a replacement copy, if necessary. Please note that each printed book you order from us is individually made by Packt's professional book-printing partner which is on a print-on-demand basis.

What tax is charged? Chevron down icon Chevron up icon

Currently, no tax is charged on the purchase of any print book (subject to change based on the laws and regulations). A localized VAT fee is charged only to our European and UK customers on eBooks, Video and subscriptions that they buy. GST is charged to Indian customers for eBooks and video purchases.

What payment methods can I use? Chevron down icon Chevron up icon

You can pay with the following card types:

  1. Visa Debit
  2. Visa Credit
  3. MasterCard
  4. PayPal
What is the delivery time and cost of print books? Chevron down icon Chevron up icon

Shipping Details

USA:

'

Economy: Delivery to most addresses in the US within 10-15 business days

Premium: Trackable Delivery to most addresses in the US within 3-8 business days

UK:

Economy: Delivery to most addresses in the U.K. within 7-9 business days.
Shipments are not trackable

Premium: Trackable delivery to most addresses in the U.K. within 3-4 business days!
Add one extra business day for deliveries to Northern Ireland and Scottish Highlands and islands

EU:

Premium: Trackable delivery to most EU destinations within 4-9 business days.

Australia:

Economy: Can deliver to P. O. Boxes and private residences.
Trackable service with delivery to addresses in Australia only.
Delivery time ranges from 7-9 business days for VIC and 8-10 business days for Interstate metro
Delivery time is up to 15 business days for remote areas of WA, NT & QLD.

Premium: Delivery to addresses in Australia only
Trackable delivery to most P. O. Boxes and private residences in Australia within 4-5 days based on the distance to a destination following dispatch.

India:

Premium: Delivery to most Indian addresses within 5-6 business days

Rest of the World:

Premium: Countries in the American continent: Trackable delivery to most countries within 4-7 business days

Asia:

Premium: Delivery to most Asian addresses within 5-9 business days

Disclaimer:
All orders received before 5 PM U.K time would start printing from the next business day. So the estimated delivery times start from the next day as well. Orders received after 5 PM U.K time (in our internal systems) on a business day or anytime on the weekend will begin printing the second to next business day. For example, an order placed at 11 AM today will begin printing tomorrow, whereas an order placed at 9 PM tonight will begin printing the day after tomorrow.


Unfortunately, due to several restrictions, we are unable to ship to the following countries:

  1. Afghanistan
  2. American Samoa
  3. Belarus
  4. Brunei Darussalam
  5. Central African Republic
  6. The Democratic Republic of Congo
  7. Eritrea
  8. Guinea-bissau
  9. Iran
  10. Lebanon
  11. Libiya Arab Jamahriya
  12. Somalia
  13. Sudan
  14. Russian Federation
  15. Syrian Arab Republic
  16. Ukraine
  17. Venezuela