Visual Studio Code – the editing features
Visual Studio Code provides many of the features that you would expect from the best-in-class code editor. If you are familiar with Visual Studio, you might have noticed that some features have been engineered in a similar way.
Developed by developers for developers, Visual Studio Code has keyboard shortcuts for almost every editing command, giving you the option to edit code faster and completely forget about the mouse. Let’s study the most used features in the following sections.
Comment lines
Visual Studio Code provides out-of-the-box commands for text selection and professional editing in the Edit menu. The Edit menu also includes Toggle Line Comment, which adds a line comment for the selected line. This means that if you select 10 lines of code, Visual Studio Code will comment out the selected lines. The beauty of this command is that it works in reverse as well. If you select the 10 commented lines and press Toggle Line Comment, the comments will be magically removed. It is also possible to select Toggle Block Comment and revert this back (Shift + Alt + A).
For developers working with CSIDE, the old legacy language for on-premises Dynamics 365 Business Central, this command is the equivalent of Comment Selection (Shift + Ctrl + K) and Uncomment Selection (Shift + Ctrl + O).
Delimiter matching
Visual Studio Code can detect pairs of delimiters, such as brackets and parentheses. This feature is helpful if you want to delimit code blocks, and it kicks in when the mouse is placed near one of the delimiter pairs:

Figure 2.16: Delimiter brackets
Thanks to this feature, we can easily see that the brackets on lines 9 and 11 are matching. This is a simple example, but when working with code that uses multiple parentheses, it can be a helpful quality-of-life feature to quickly see which bracket corresponds to which.
Text selection
The Selection menu also has commands that relate to text selection, but most of them are used to move or duplicate lines of code above and below the selected line.
If you position the cursor near an AL function, variable, or constant, you can use Add Next Occurrence (Ctrl+ D), Add Previous Occurrence, or Select All Occurrences (Shift+ Ctrl+ D) to select occurrences of the selected item, and occurrences will be highlighted in a different color.
Code block folding
If you hover over line numbers in the code editor, a downward-pointing arrow will appear close to the initial part of a code block. Click on it to fold it, and a right arrow will appear. Click on this, and the code block unfolds:

Figure 2.17: Folded code on lines 5 and 18
The preceding screenshot shows two folded code blocks, depicted with right arrows.
Multiple cursors (or multi-cursors)
Each cursor operates independently. Alt + click will generate a secondary cursor at the desired position.
The most common development situation in which you want to go for multiple cursors is when you need to add or replace the same text in different positions but within the same source file. The following screenshot shows three cursors in action when editing the AL Language DataClassification property:
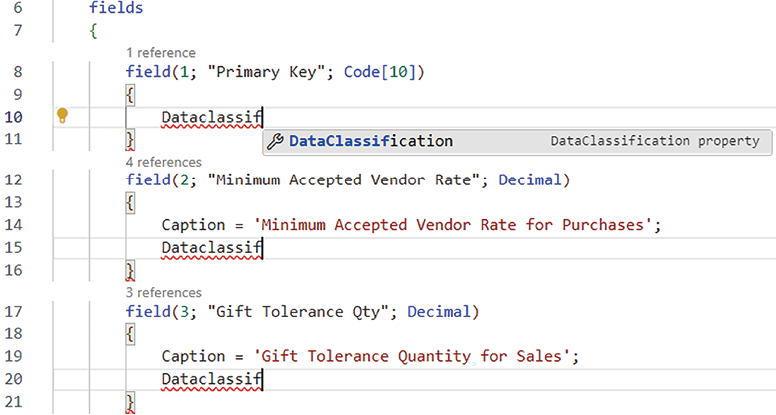
Figure 2.18: Multi-cursors on lines 10, 15, and 20
This is a great feature for AL language developers, especially when they have to write down the same sentence many times in the same place (for example, Caption or DataClassification in a table object and for each table field).
Mini-map
Sometimes, when working with very long files such as report definition language (RDL) files or codeunits, it is difficult to know where the pointer should be positioned – or is positioned – within a source file. Visual Studio Code has a fully fledged mini-map feature: a small preview of the source code file. The following is an example of an RDL:
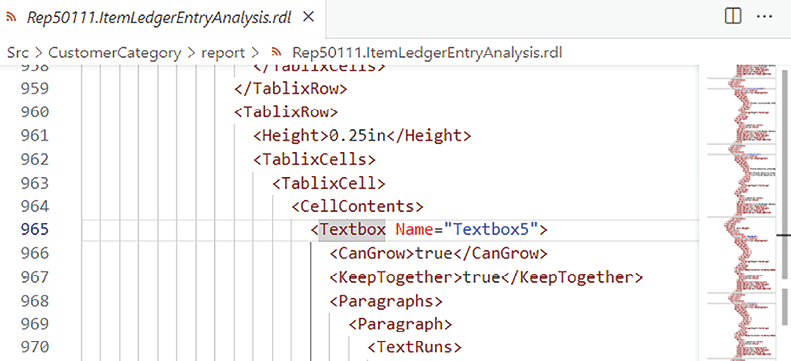
Figure 2.19: Mini-map for an RDL file
The mini-map feature can be disabled/enabled through View | Appearance | Minimap, or by running the Command Palette (F1) and selecting View: Toggle Minimap.
Breadcrumbs
The Show Breadcrumbs command is available by clicking View | Appearance | Breadcrumbs or via the Command Palette (F1) and selecting View: Toggle Breadcrumbs. With AL files, you can click each element of the breadcrumb to inspect and explore the levels in the current object. There is a bit of text in the top-left corner of the code editor that can be expanded to easily double-check the definitions of properties, functions, fields, keys, and so on. If you click on an element in the expanded list, the cursor will jump to its primary definition, making code navigation quite fast and productive.
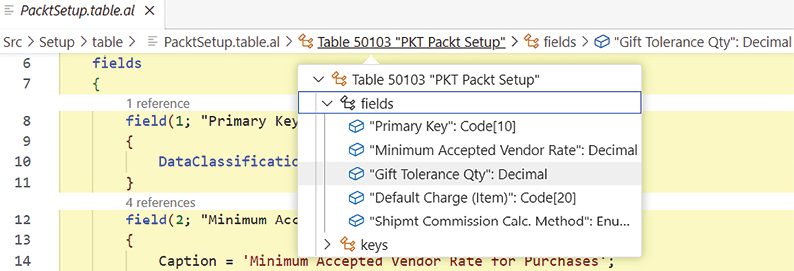
Figure 2.20: Viewing breadcrurmb elements
IntelliSense
In visual editors, IntelliSense is a word completion tool that appears as a pop-up list while you type. Visual Studio Code IntelliSense can provide smart suggestions, showing the definition and purpose – like online help – related to a specific element. The following screenshot shows IntelliSense in action:
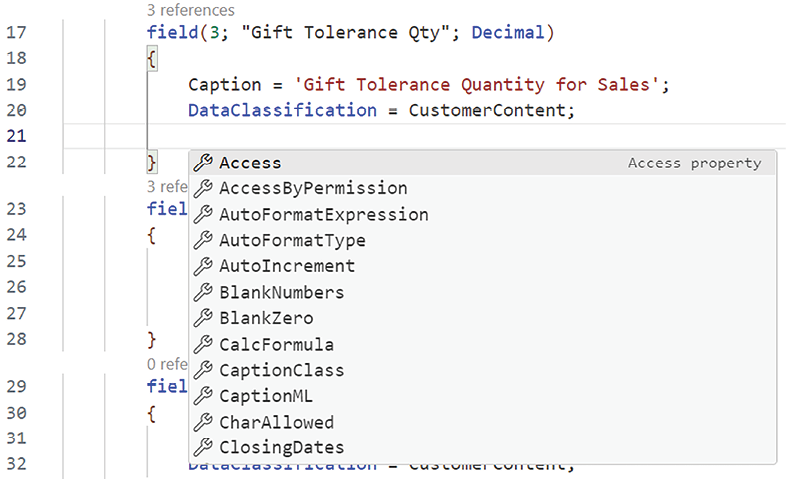
Figure 2.21: IntelliSense word completion
IntelliSense is context-sensitive, and if you need to enable it directly without typing anything, just press Ctrl + spacebar. Depending on the context where the cursor is placed, IntelliSense will show all the items that can be used in that context. For example, inside a Table Field declaration, it will list all the specific field properties, such as Caption and CaptionML, while in an empty codeunit definition, it will show all the properties that are exposed by a codeunit object.
Word completion
Through the IntelliSense feature, the code editor in Visual Studio Code implements word completion for all native (such as JSON) and extension-based supported languages (such as AL). Just press Enter or Tab to insert the suggested word.
Go to definition
This is a super-cool, must-know feature. You can hover over a variable, constant, function, or whatever code element you want with the mouse, and if you press Ctrl, the word or identifier (known also as a symbol) will magically switch into a hyperlink.
If you click on the word while pressing Ctrl, you will be automatically redirected to the code that defines that word. Pressing Ctrl + hovering over a code element also enables the Go To Definition feature.
Other possible ways to enable this feature are as follows:
- Select a code element and press F12.
- Right-click on a code element and then select Go To Definition from the context menu.
Find all references
Find All References makes it very easy to parse how many times and where an object, a function, or any code element has been used across source code. You can simply right-click on any variable, function, or element name and then select Find All References, or use the keyboard shortcut Shift + Alt + F12.
When it’s enabled, the code editor will create a result list in the activity bar showing how many times it has been referenced, and in which object files and position(s). A shortcut icon is created in the sidebar called References. The following screenshot shows how to find all references in AL files for a specific variable:
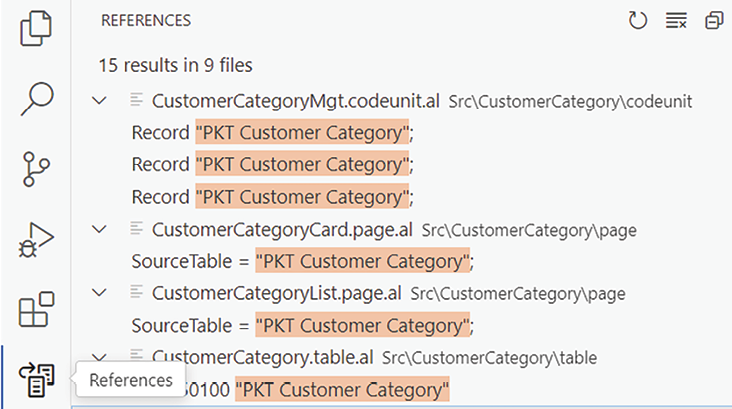
Figure 2.22: Finding multiple referenes in source code
If you expand an occurrence in the references list on the left and click on a record, the code editor will open the file where it is referenced and position the cursor in editing mode, selecting the element searched in that file.
The references list can be cleared and refreshed, and you can collapse all the elements in it. If you clear the list, you can always run the previous search again, since the history is maintained for you.
Peek definition
Imagine that you have a large number of code files, and you need to edit the definition of a variable or field that you are currently using. With many other editors – or development environments – you most likely have to save all the files in text format, then search through all these code files and be sure to replace that variable name. This task not only can be annoying but can also distract you from the original code you were writing.
Visual Studio Code brilliantly solves this problem by providing the Peek feature, which can be enabled in different ways:
- Right-click a variable, field, or function name and select Peek Definition.
- Use the Alt + F12 keyboard shortcut.
An interactive pop-up window should appear, showing the source code that defines the selected element.
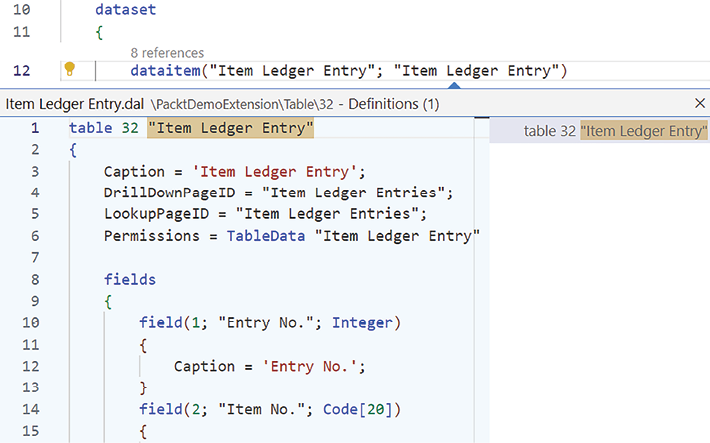
Figure 2.23: Using the Peek feature to locate a definition
The above screenshot shows the Peek Definition for a table source, bound to a dataitem element in a report. You can then see what has been written and directly edit it.
Renaming symbols
For a developer, it is very common to rename a variable, constant, field, or function. These coding elements are technically called symbols. Visual Studio Code provides a very powerful feature to rename symbols.
If you press F2 on the coding element that you wish to rename, or right-click and then select Rename Symbol, a small interactive popup appears in edit mode. There, you can write the new element name without using a distracting dialog window, allowing you to concentrate on your coding. All references to that code element will be renamed accordingly. The following screenshot shows renaming a procedure symbol reference:

Figure 2.24: Renaming a symbol
All the features shown so far are the most useful features provided by Visual Studio Code that support proficient code editing for AL developers. At this stage, then, it is important to take a closer look at the AL Language extension and see how to configure it to achieve more from the development environment.


