Search icon CANCEL
Subscription
0
Cart icon
Your Cart (0 item)
Close icon
You have no products in your basket yet
Arrow left icon
Explore Products
Best Sellers
New Releases
Books
Videos
Audiobooks
Learning Hub
Free Learning
Arrow right icon
Arrow up icon
GO TO TOP
Zabbix 4 Network Monitoring

You're reading from   Zabbix 4 Network Monitoring Monitor the performance of your network devices and applications using the all-new Zabbix 4.0

Arrow left icon
Product type Paperback
Published in Jan 2019
Publisher
ISBN-13 9781789340266
Length 798 pages
Edition 3rd Edition
Languages
Tools
Arrow right icon
Author (1):
Arrow left icon
Patrik Uytterhoeven Patrik Uytterhoeven
Author Profile Icon Patrik Uytterhoeven
Patrik Uytterhoeven
Arrow right icon
View More author details
Toc

Table of Contents (25) Chapters Close

Preface 1. Getting Started with Zabbix FREE CHAPTER 2. Getting Your First Notification 3. Monitoring with Zabbix Agents and Basic Protocols 4. Monitoring SNMP Devices 5. Managing Hosts, Users, and Permissions 6. Detecting Problems with Triggers 7. Acting upon Monitored Conditions 8. Simplifying Complex Configurations with Templates 9. Visualizing Data with Screens and Slideshows 10. Advanced Item Monitoring 11. Automating Configuration 12. Monitoring Web Pages 13. High-Level Business Service Monitoring 14. Monitoring IPMI Devices 15. Monitoring Java Applications 16. Monitoring VMware 17. Using Proxies to Monitor Remote Locations 18. Encrypting Zabbix Traffic 19. Working Closely with Data 20. Zabbix Maintenance 21. Troubleshooting 22. Being Part of the Community 23. Assessment 24. Other Books You May Enjoy

Internal monitoring

Zabbix can monitor a lot of things about other systems, but what do we know about Zabbix itself? We can see a few basic indicators in the Zabbix frontend right away. In the frontend, go to Reports | System information. Here, we can observe high-level information, such as whether the Zabbix server is running, and values such as the number of hosts, items, triggers, and users online.

This information is also visible as a widget in the dashboard. Both the widget and the report are available to super admin users only.

Let's look at the value next to Required server performance, new values per second. It's the main value when determining how large a Zabbix installation is:
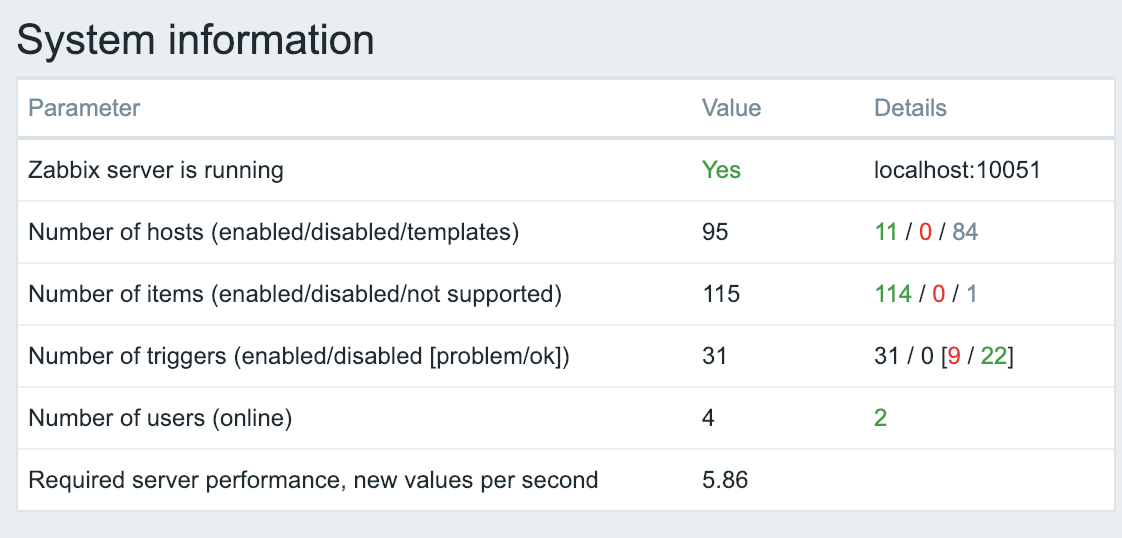
New values per second

Why...

lock icon The rest of the chapter is locked
Register for a free Packt account to unlock a world of extra content!
A free Packt account unlocks extra newsletters, articles, discounted offers, and much more. Start advancing your knowledge today.
Unlock this book and the full library FREE for 7 days
Get unlimited access to 7000+ expert-authored eBooks and videos courses covering every tech area you can think of
Renews at $19.99/month. Cancel anytime
Banner background image