Search icon CANCEL
Subscription
0
Cart icon
Cart
Close icon
You have no products in your basket yet
Save more on your purchases!
Savings automatically calculated. No voucher code required
Arrow left icon
All Products
Best Sellers
New Releases
Books
Videos
Audiobooks
Learning Hub
Newsletters
Free Learning
Arrow right icon
Arrow up icon
GO TO TOP
Python Data Analysis - Third Edition

You're reading from  Python Data Analysis - Third Edition

Product type Book
Published in Feb 2021
Publisher Packt
ISBN-13 9781789955248
Pages 478 pages
Edition 3rd Edition
Languages
Authors (2):
Avinash Navlani Avinash Navlani
Profile icon Avinash Navlani
Ivan Idris Ivan Idris
Profile icon Ivan Idris
View More author details
Toc

Table of Contents (20) Chapters close

Preface 1. Section 1: Foundation for Data Analysis
2. Getting Started with Python Libraries 3. NumPy and pandas 4. Statistics 5. Linear Algebra 6. Section 2: Exploratory Data Analysis and Data Cleaning
7. Data Visualization 8. Retrieving, Processing, and Storing Data 9. Cleaning Messy Data 10. Signal Processing and Time Series 11. Section 3: Deep Dive into Machine Learning
12. Supervised Learning - Regression Analysis 13. Supervised Learning - Classification Techniques 14. Unsupervised Learning - PCA and Clustering 15. Section 4: NLP, Image Analytics, and Parallel Computing
16. Analyzing Textual Data 17. Analyzing Image Data 18. Parallel Computing Using Dask 19. Other Books You May Enjoy

Central limit theorem

Data analysis methods involve hypothesis testing and deciding confidence intervals. All statistical tests assume that the population is normally distributed. The central limit theorem is the core of hypothesis testing. According to this theorem, the sampling distribution approaches a normal distribution with an increase in the sample size. Also, the mean of the sample gets closer to the population means and the standard deviation of the sample gets reduced. This theorem is essential for working with inferential statistics, helping data analysts figure out how samples can be useful in getting insights about the population.

Does it provide answers to questions such as what size of sample should be taken or which sample size is an accurate representation of the population? You can understand this with the help of the following diagram:

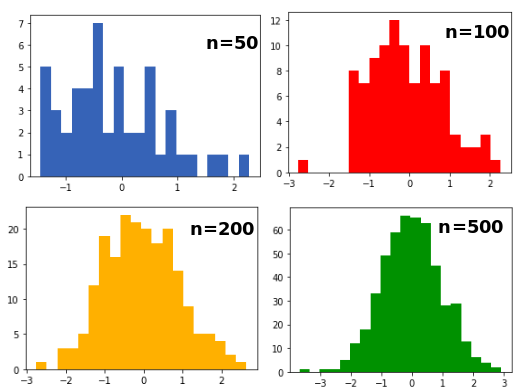
In the preceding diagram, you can see four histograms for different-different sample sizes 50, 100, 200, and 500. If you observe...

lock icon The rest of the chapter is locked
Register for a free Packt account to unlock a world of extra content!
A free Packt account unlocks extra newsletters, articles, discounted offers, and much more. Start advancing your knowledge today.
Unlock this book and the full library FREE for 7 days
Get unlimited access to 7000+ expert-authored eBooks and videos courses covering every tech area you can think of
Renews at €14.99/month. Cancel anytime}