Search icon CANCEL
Subscription
0
Cart icon
Cart
Close icon
You have no products in your basket yet
Save more on your purchases!
Savings automatically calculated. No voucher code required
Arrow left icon
All Products
Best Sellers
New Releases
Books
Videos
Audiobooks
Learning Hub
Newsletters
Free Learning
Arrow right icon
Arrow up icon
GO TO TOP
Python Data Analysis - Third Edition

You're reading from  Python Data Analysis - Third Edition

Product type Book
Published in Feb 2021
Publisher Packt
ISBN-13 9781789955248
Pages 478 pages
Edition 3rd Edition
Languages
Authors (2):
Avinash Navlani Avinash Navlani
Profile icon Avinash Navlani
Ivan Idris Ivan Idris
Profile icon Ivan Idris
View More author details
Toc

Table of Contents (20) Chapters close

Preface 1. Section 1: Foundation for Data Analysis
2. Getting Started with Python Libraries 3. NumPy and pandas 4. Statistics 5. Linear Algebra 6. Section 2: Exploratory Data Analysis and Data Cleaning
7. Data Visualization 8. Retrieving, Processing, and Storing Data 9. Cleaning Messy Data 10. Signal Processing and Time Series 11. Section 3: Deep Dive into Machine Learning
12. Supervised Learning - Regression Analysis 13. Supervised Learning - Classification Techniques 14. Unsupervised Learning - PCA and Clustering 15. Section 4: NLP, Image Analytics, and Parallel Computing
16. Analyzing Textual Data 17. Analyzing Image Data 18. Parallel Computing Using Dask 19. Other Books You May Enjoy

Creating pivot tables

A pivot table is a summary table. It is the most popular concept in Excel. Most data analysts use it as a handy tool to summarize theire results. pandas offers the pivot_table() function to summarize DataFrames. A DataFrame is summarized using an aggregate function, such as mean, min, max, or sum. You can download the dataset from the following GitHub link: https://github.com/PacktPublishing/Python-Data-Analysis-Third-Edition/tree/master/Python-Data-Analysis-Third-Edition/Ch2:

# Import pandas
import pandas as pd

# Load data using read_csv()
purchase = pd.read_csv("purchase.csv")

# Show initial 10 records
purchase.head(10)

This results in the following output:

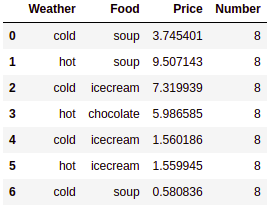
In the preceding code block, we have read the purchase.csv file using the read_csv() method.

Now, we will summarize the dataframe using the following code:

# Summarise dataframe using pivot table
pd.pivot_table(purchase,values='Number', index=['Weather',],
columns...
lock icon The rest of the chapter is locked
Register for a free Packt account to unlock a world of extra content!
A free Packt account unlocks extra newsletters, articles, discounted offers, and much more. Start advancing your knowledge today.
Unlock this book and the full library FREE for 7 days
Get unlimited access to 7000+ expert-authored eBooks and videos courses covering every tech area you can think of
Renews at €14.99/month. Cancel anytime}