Search icon CANCEL
Subscription
0
Cart icon
Cart
Close icon
You have no products in your basket yet
Save more on your purchases!
Savings automatically calculated. No voucher code required
Arrow left icon
All Products
Best Sellers
New Releases
Books
Videos
Audiobooks
Learning Hub
Newsletters
Free Learning
Arrow right icon
Arrow up icon
GO TO TOP
Python Data Analysis - Third Edition

You're reading from  Python Data Analysis - Third Edition

Product type Book
Published in Feb 2021
Publisher Packt
ISBN-13 9781789955248
Pages 478 pages
Edition 3rd Edition
Languages
Authors (2):
Avinash Navlani Avinash Navlani
Profile icon Avinash Navlani
Ivan Idris Ivan Idris
Profile icon Ivan Idris
View More author details
Toc

Table of Contents (20) Chapters close

Preface 1. Section 1: Foundation for Data Analysis
2. Getting Started with Python Libraries 3. NumPy and pandas 4. Statistics 5. Linear Algebra 6. Section 2: Exploratory Data Analysis and Data Cleaning
7. Data Visualization 8. Retrieving, Processing, and Storing Data 9. Cleaning Messy Data 10. Signal Processing and Time Series 11. Section 3: Deep Dive into Machine Learning
12. Supervised Learning - Regression Analysis 13. Supervised Learning - Classification Techniques 14. Unsupervised Learning - PCA and Clustering 15. Section 4: NLP, Image Analytics, and Parallel Computing
16. Analyzing Textual Data 17. Analyzing Image Data 18. Parallel Computing Using Dask 19. Other Books You May Enjoy

Resizing images

Resizing an image means changing the dimension or scaling of a given image. Scaling or resizing is done either from the width, height, or both. One of the applications of resizing images is training deep learning models where reduced image sizes can speed up the training. Training a deep learning model is out of the scope of this book. If you are interested, then you can refer to any deep learning book from Packt Publishing. Let's see an example of resizing an image:

# Import cv2 module
import cv2

# Import matplotlib for showing the image
import matplotlib.pyplot as plt

# magic function to render the figure in a notebook
%matplotlib inline

# read image
image = cv2.imread('tajmahal.jpg')

# Convert image color space BGR to RGB
rgb_image=cv2.cvtColor(image,cv2.COLOR_BGR2RGB)

# Display the image
plt.imshow(rgb_image)

This results in the following output:

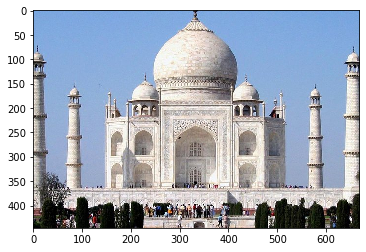
In the preceding code, we read the image and converted it from BGR into the RGB space. Let's resize it now using...

lock icon The rest of the chapter is locked
Register for a free Packt account to unlock a world of extra content!
A free Packt account unlocks extra newsletters, articles, discounted offers, and much more. Start advancing your knowledge today.
Unlock this book and the full library FREE for 7 days
Get unlimited access to 7000+ expert-authored eBooks and videos courses covering every tech area you can think of
Renews at €14.99/month. Cancel anytime}