Search icon CANCEL
Subscription
0
Cart icon
Cart
Close icon
You have no products in your basket yet
Save more on your purchases!
Savings automatically calculated. No voucher code required
Arrow left icon
All Products
Best Sellers
New Releases
Books
Videos
Audiobooks
Learning Hub
Newsletters
Free Learning
Arrow right icon
Arrow up icon
GO TO TOP
Python Data Analysis - Third Edition

You're reading from  Python Data Analysis - Third Edition

Product type Book
Published in Feb 2021
Publisher Packt
ISBN-13 9781789955248
Pages 478 pages
Edition 3rd Edition
Languages
Authors (2):
Avinash Navlani Avinash Navlani
Profile icon Avinash Navlani
Ivan Idris Ivan Idris
Profile icon Ivan Idris
View More author details
Toc

Table of Contents (20) Chapters close

Preface 1. Section 1: Foundation for Data Analysis
2. Getting Started with Python Libraries 3. NumPy and pandas 4. Statistics 5. Linear Algebra 6. Section 2: Exploratory Data Analysis and Data Cleaning
7. Data Visualization 8. Retrieving, Processing, and Storing Data 9. Cleaning Messy Data 10. Signal Processing and Time Series 11. Section 3: Deep Dive into Machine Learning
12. Supervised Learning - Regression Analysis 13. Supervised Learning - Classification Techniques 14. Unsupervised Learning - PCA and Clustering 15. Section 4: NLP, Image Analytics, and Parallel Computing
16. Analyzing Textual Data 17. Analyzing Image Data 18. Parallel Computing Using Dask 19. Other Books You May Enjoy

ARMA models

The ARMA model blends autoregression and moving averages. The ARMA model is commonly referred to as ARMA(p,q), where p is the order of the autoregressive part, and q is the order of the moving average:

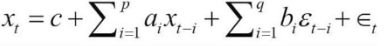
In the preceding formula, just like in the autoregressive model formula, we have a constant and a white noise component; however, we try to fit the lagged noise components as well:

  1. Import the libraries and read the dataset:
# import needful libraries
import statsmodels.api as sm
from statsmodels.tsa.arima_model import ARMA
from sklearn.metrics import mean_absolute_error
from sklearn.metrics import mean_squared_error
import matplotlib.pyplot as plt
from math import sqrt

# Read the dataset
data = sm.datasets.sunspots.load_pandas().data
data.drop('YEAR',axis=1,inplace=True)
  1. Split the Sunspot data into train and test sets:
# Split data into train and test set
train_ratio=0.8
train=data[:int(train_ratio*len(data))]
test=data[int(train_ratio...
lock icon The rest of the chapter is locked
Register for a free Packt account to unlock a world of extra content!
A free Packt account unlocks extra newsletters, articles, discounted offers, and much more. Start advancing your knowledge today.
Unlock this book and the full library FREE for 7 days
Get unlimited access to 7000+ expert-authored eBooks and videos courses covering every tech area you can think of
Renews at €14.99/month. Cancel anytime}