Exploring ArcGIS for Desktop
As you saw in ArcGIS Administrator Wizard, ArcGIS for Desktop has three levels of functionality: Basic (formerly ArcView), Standard (formerly ArcEditor), and Advanced (formerly ArcInfo). All these three products comprise two main applications: ArcMap and ArcCatalog. These two applications look and work the same for the three license levels but are differentiated by the functionality that they provide. The 10.3 version of ArcGIS for Desktop released a third new application called ArcGIS Pro in January 2015.
Note
This book will not cover the ArcGIS Pro concepts.
If you want to learn about ArcGIS Pro, we recommend the book Learning ArcGIS Pro, Tripp Corbin, Packt Publishing, which can be found at https://www.packtpub.com/application-development/learning-arcgis-pro.
ArcCatalog
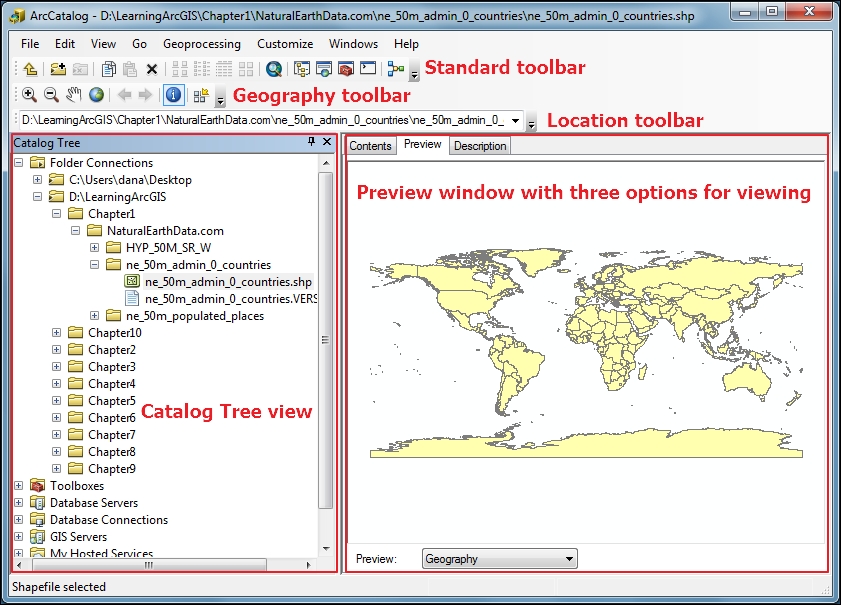
The ArcCatalog application allows users to explore, manage, and even document their spatial or nonspatial data. The interface of ArcCatalog is shown in the following screenshot:

Catalog Tree shows the folders and data files, geodatabases, database connections, GIS servers, and custom and system toolboxes. Think of the Catalog Tree as the Windows Explorer of ArcGIS. The Catalog Tree window can be accessed in the ArcMap application, too.
The Preview window allows you to view and explore the geometric shapes and attributes of features stored in the dataset selected in the Catalog Tree.
ArcCatalog has three options to view the selected items in the Preview window:
- Contents: This is a quick view of the content of a selected item in the Catalog Tree (for example, a folder or geodatabase content)
- Preview: This is used to view and explore the geography (geometry) and attributes of features stored in the dataset selected in Catalog Tree
- Description: This is used to view and edit the information about data, known as metadata or "data about data"
Note
This book includes datasets that you will need to complete the exercises here. Before you can work with these datasets, you have to download them from your account at http://www.packtpub.com.
If you purchased this book elsewhere, then you can visit https://www.packtpub.com/books/content/support and register there to have these files e-mailed directly to you.
This training dataset will require at least 10 GB of free space on your working hard disk. Extract the training data from the archive on your working disk in a new folder named
LearningArcGIS.
Follow these steps to add some publicly available data from NaturalEarthData.com:
- From www.naturalearthdata.com/downloads/, download the following themes after navigating to Medium scale data (1:50m) | Cultural—
Admin 0-Countries(click the Download countries button) andPopulated Places(click the Download populated places button). Also, download theNatural Earth 1 with Shaded Reliefraster from the Raster\Natural Earth 1 section. - Unzip the archive files to
<drive>:\LearningArcGIS\Chapter1\NaturalEarthData.Tip
If you didn't succeed in downloading and unzipping the data, you can find the necessary datasets at
<drive>:\LearningArcGIS\Chapter1\Results.
Follow these steps to explore the data in the ArcCatalog application:
- Start the ArcCatalog application by navigating to Start | All Programs | ArcGIS.
- To see the downloaded datasets in the panel from the left-hand side of the window named Catalog Tree, click Connect To Folder from the Standard toolbar. Go to
<drive>:\LearningArcGIS\Chapter1and click OK. In Catalog Tree, expand theNaturalEarthData\ ne_50m_admin_0_countriesfolder and select the polygon shapefile namedne_50m_admin_0_countries.shp, as shown in the previous screenshot. - If you don't see the file extension of shapefile (
*.shp), go to the Customize menu, select ArcCatalog Options, click the General tab, and uncheck the option, Hide file extension. Click OK to close ArcCatalog Options.Note
The shapefile format (
.shp) is an Esri vector data format. Even if ArcCatalog displays it as a single file, shapefile is a set of differently-related files that store geometric and attribute information of the geographic features. For more information about the shapefile format, please refer to ESRI Shapefile Technical Description, ESRI White Paper-July 1998 at https://www.esri.com/library/whitepapers/pdfs/shapefile.pdf. - In the right-hand side of the window, select the Preview tab to see the map of the countries. Use the Zoom In, Zoom Out, and Pan tools from the Geography toolbar to explore data in the preview window.
- From the Geography toolbar, click the Identify tool. Then, click on any country in the preview window. The Identify Results window shows the attributes of the country that you have just clicked.
- If you want to see the attributes for all countries, click the drop-down arrow next to Preview from the bottom of the preview window and select Table. You can now see the attribute table of all 241 countries.
- Let's examine these attributes. Scroll through the table and select the
namefield. We will search theUnited Kingdomvalue in the selected field. Click the Table Options button from the bottom left corner of the preview window and select Find. In the Find window, for Find what, typeUnited Kingdom. Check the Search Only Selected Field(s) option and click Find Next to search for the record. The record with theFID=77value and thename =United Kingdomfield is underlined in the attribute table. When finished, click Cancel to close the Find window. - Return to the geography view mode by selecting Geography from the drop-down arrow next to Preview.
- Repeat these steps to explore the shapefile named
ne_50m_populated_places.shpand the shaded relief file namedHYP_50M_SR_W.tif.Tip
The shapefile's green icon next to the shapefile's name indicates what type of geometry is stored in it: point, polyline, or polygon. Also, the color of the icons is tied to the data format. For example, the geodatabase icon is gray, and the CAD files are blue.
- Close the ArcCatalog application.
ArcMap
The ArcMap application allows users to visualize, create, edit, query, and analyze spatial or nonspatial data. ArcMap works with map document files. A map document file (.mxd) stores the reference to the data source (for example, the reference to the ne_50m_admin_0_countries.shp shapefile), the reference to your symbol styles, how your data is displayed and symbolized on a map, and other properties related to your data.
Tip
A map document does not store a copy of your data.
The ArcMap interface is shown in the following screenshot:

In ArcMap, a Data frame is a container for the layers displayed on a map. Think of the data frame as a classic map. All layers from a data frame will be displayed in the same coordinate system, which is the property of the data frame. In one map document, you can have multiple data frames with different coordinate systems.
A Layer is a visual display of your dataset in ArcMap. For example, you can add the same shapefile, named ne_50m_admin_0_countries.shp, three times in ArcMap, and the Table Of Contents window will automatically display them as three layers, symbolized with different symbols, as shown in the following screenshot:

A layer can be stored in a map document (*.mxd) or as an individual layer file (*.lyr). ArcMap has two methods of map display: Data View and Layout View. In the Data View mode, you can view, create, edit, symbolize, and analyze data from only one data frame at a time. In the Layout View mode, you can use multiple data frames to create final professional maps (map layout) for print or digital view.
Note
Note that all steps in this subsection have to be completed in one session.
Follow these steps to add spatial data as layers to ArcMap:
- Start the ArcMap application by navigating to Start | All Programs | ArcGIS or using the ArcMap button on the Standard toolbar, in ArcCatalog application.
- In the ArcMap-Getting Started window, select the Blank Map user template from New Maps | My Templates, as shown in the following screenshot:

- Click on OK. The ArcMap interface will open with an empty and untitled map document.
- Click on the Add Data button from Standard toolbar. Double-click Folder Connections and select the
HYP_50M_SR_W.tifraster from<drive>:\LearningArcGIS\Chapter1\NaturalEarthData\HYP_50M_SR_W. Click the Add button. - The land cover raster has been added in the Table of Contents window as a layer in the default data frame named
Layers. To change the name of the data frame, click the wordLayersto select it, then click it again, and typeNatural Earth 1:50m.Tip
If you accidentally double-click the data frame's name, the Data Frame Properties window will be opened. If you double-click the layer's name, the Layer Properties window will be opened.
- Change the name of layer from
HYP_50M_SR_W.tiftoLand cover&Shadedreliefby following the previous step.
Let's try another way to add data to a map document:
- Click on the Catalog tab on the left-hand side of the ArcMap interface. The Catalog window can be also opened using the Catalog button from the Standard toolbar.
- In the Catalog window, double-click Connect to Folder and select the
ne_50m_admin_0_countries.shpshapefile from<drive>:\LearningArcGIS\Chapter1\NaturalEarthData\ne_50m_admin_0_countries. Drag the selected polygon shapefile and drop it into the map display area. - Repeat the previous step to add
ne_50m_populated_places.shpshapefile to Table Of Contents as a layer. - You can reordering map layers in Table Of Contents by clicking the layer and dragging it below or above the existing layers. You can order the map layers, only if they are in List by Draw Order. You cannot adjust the layer order in Table of Contents if they are listed in the following ways of listing layers: List By Source, List By Visibility, and List By Selection.
We will now change the name and symbols of the last two layers:
- In Table of Contents, right-click the
ne_50m_admin_0_countries.shplayer and select Properties. - In the Layer Properties window, click the General tab; and for Layer Name, replace the existing name by typing
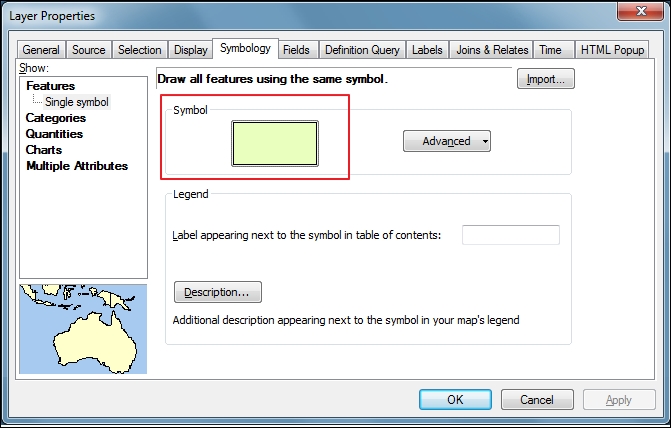
Countries. Changing the layer name does not change the name of the source dataset. Click Apply. - Click on the Symbology tab, and for Symbol, click the rectangular symbol button to open the Symbol Selector window, as shown in the following screenshot:

- In the Symbol Selector window, select the Olive style and click OK to close the Symbol Selector window.
You may have noticed that the Countries layer is obscuring the shaded relief layer in the map display. You will now add transparency to the Countries layer symbols:
- In the Layer Properties window, click the Display tab; and for Transparent, type
50. Click the Apply button to apply the changes to the layer and click OK to save the applied changes and close the Layer Properties window. - Use the Zoom In, Zoom Out, and Pan tools from the Tools toolbar to inspect the results in the map display area.
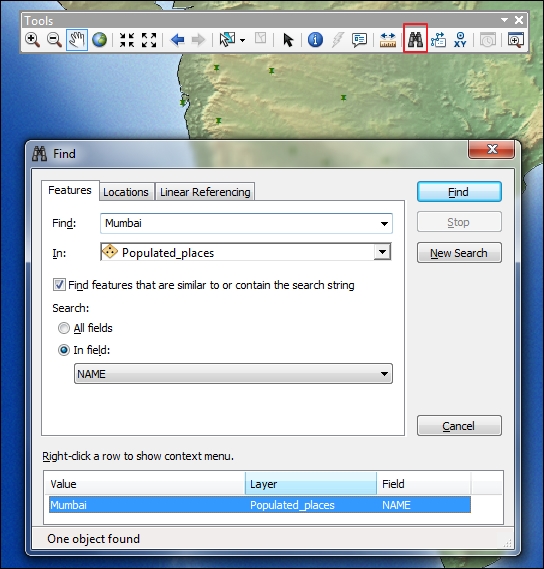
- Click on the Find tool from the Tools toolbar and set the parameters, as shown in the following screenshot:

- Check whether the Features panel is active; and for the Find text box, type
Mumbai. For the In drop-down list, select thePopulated_placeslayer (ne_50m_populated_places.shp), and for the In field drop-down list, select NAME. Click Find. At the bottom of the Find window, right-click the displayed result and select Zoom To. The city has been centered in the map display. - If you want to see the attributes of the point feature, right-click the search result and select Identify. In the Identify window, scroll through the fields list and search for the ADMoNAME field to see the name of the country. Click Cancel to close the Find window.
- Let's confirm the country name using the information stored in the
Countrieslayer. Click the Identify tool and click the map display. For Identify, from the drop-down list, select the Countries layer (ne_50m_admin_0_countries.shp).
Now let's explore another part of the world using their geographic coordinates, as shown in the following screenshot:

The coordinate system of our datasets is WGS 1984, which is a geographic coordinate system, and units of measurement are expressed in degrees. Let's search for a location using geographic coordinates:
- Select Go To XY from the Tools toolbar. By default, the geographic coordinates are expressed as Degrees Minutes Seconds. You can change this to Decimal Degrees by clicking the drop-down arrow from the top of the Go To XY window. Under the field Long:, type
5degrees, and for Lat:, type50degrees. Press the Enter key. - Click the Add Labeled Point button under Go To XY window to add a graphic point with information about its geographic coordinates in the map display.
- To get some additional information about the area around the point, select the Identify tool and click the green graphic point. For Identify window, from the drop-down list, select the
Countrieslayer. What is the name of the country that you selected? - Close the Identify window.
Before closing the ArcMap, save your map document work, symbols, and green point labeled into an ArcMap Document (*.mxd):
- From Main menu, go to File | Save As....
- Go to
<drive>:\LearningArcGIS\Chapter1\NaturalEarthData. - Name the file as
MyChapter01. - Exit ArcMap by selecting File | Exit from the Main menu.
ArcToolbox
The ArcToolbox window is embedded in both applications: ArcCatalog and ArcMap. ArcToolbox contains collections of toolboxes, toolsets, and system tools for data management and analysis, cartography, data format conversion, and other tasks, as shown in the following screenshot:

To increase its efficiency, ArcToolbox should be used in conjunction with the Search and Results windows. Both are available in ArcCatalog and ArcMap applications, from the Geoprocessing menu.
Some tools require their corresponding extensions to be enabled. For example, if you want to use the 3D Analyst processing tools, you should manually enable the 3D Analyst extension before working with them. To enable this extension in the ArcCatalog application, click the Customize menu and select Extensions. In the Extensions window check the 3D Analyst extension and click Close. The same step is also available in the ArcMap application.
Getting help
Getting help while you are working with ArcGIS for Desktop applications will increase productivity. If you are stuck or you want to quickly get more information about a tool or a button, then use ArcGIS Help which is accessible from all ArcGIS for Desktop applications.

There are three tabs in the upper right-hand corner of the ArcGIS Help window:
- Contents: This is where the help topics are organized into books on the left-hand side panel
- Favorites: This stores a list of your favorite or most-viewed help topics
- Search: This searches for a help topic by entering one or more keywords
Tip
To discover the ArcGIS community (for example, Web help, blogs, and forums), use ArcGIS Resource Center, which is available at http://resources.arcgis.com.


