Search icon CANCEL
Subscription
0
Cart icon
Your Cart (0 item)
Close icon
You have no products in your basket yet
Save more on your purchases! discount-offer-chevron-icon
Savings automatically calculated. No voucher code required.
Arrow left icon
Explore Products
Best Sellers
New Releases
Books
Videos
Audiobooks
Learning Hub
Newsletter Hub
Free Learning
Arrow right icon
timer SALE ENDS IN
0 Days
:
00 Hours
:
00 Minutes
:
00 Seconds
Arrow up icon
GO TO TOP
Learn Grafana 10.x

You're reading from   Learn Grafana 10.x A beginner's guide to practical data analytics, interactive dashboards, and observability

Arrow left icon
Product type Paperback
Published in Dec 2023
Publisher Packt
ISBN-13 9781803231082
Length 542 pages
Edition 2nd Edition
Languages
Tools
Arrow right icon
Author (1):
Arrow left icon
Eric Salituro Eric Salituro
Author Profile Icon Eric Salituro
Eric Salituro
Arrow right icon
View More author details
Toc

Table of Contents (23) Chapters Close

Preface 1. Part 1 – Getting Started with Grafana
2. Chapter 1: Introducing Data Visualization with Grafana FREE CHAPTER 3. Chapter 2: Touring the Grafana Interface 4. Chapter 3: Diving into Grafana's Time Series Visualization 5. Part 2 – Real-World Grafana
6. Chapter 4: Connecting Grafana to a Prometheus Data Source 7. Chapter 5: Extracting and Visualizing Data with InfluxDB and Grafana 8. Chapter 6: Shaping Data with Grafana Transformations 9. Chapter 7: Surveying Key Grafana Visualizations 10. Chapter 8: Surveying Additional Grafana Visualizations 11. Chapter 9: Creating Insightful Dashboards 12. Chapter 10: Working with Advanced Dashboard Features and Elasticsearch 13. Chapter 11: Streaming Real-Time IoT Data from Telegraf Agent to Grafana Live 14. Chapter 12: Monitoring Data Streams with Grafana Alerts 15. Chapter 13: Exploring Log Data with Grafana’s Loki 16. Part 3 – Managing Grafana
17. Chapter 14: Organizing Dashboards and Folders 18. Chapter 15: Managing Permissions for Users, Teams, and Organizations 19. Chapter 16: Authenticating Grafana Logins Using LDAP or OAuth 2 Providers 20. Chapter 17: Cloud Monitoring AWS, Azure, and GCP 21. Index 22. Other Books You May Enjoy

Duplicating dashboards

If you want to experiment with changes to a dashboard or you want to propagate a dashboard to another organization or even another server, there are two ways to duplicate or copy a dashboard.

Internal dashboard duplications

If you just want to create another version of the dashboard for experimentation or to stage prior to putting it into production, use the Save as option at the top of the dashboard Settings page. Remember, you can always roll back changes to an existing dashboard from the Versions page under dashboard Settings.

Here’s how to copy a dashboard to a new name:

  1. Open the dashboard settings.
  2. Instead of clicking Save dashboard, click on Save as. That will bring up a new dialog where you can pick a name for the copy of the dashboard:
  3. Set the name and optionally the folder. Set the tags if you’d like to keep the existing tags.
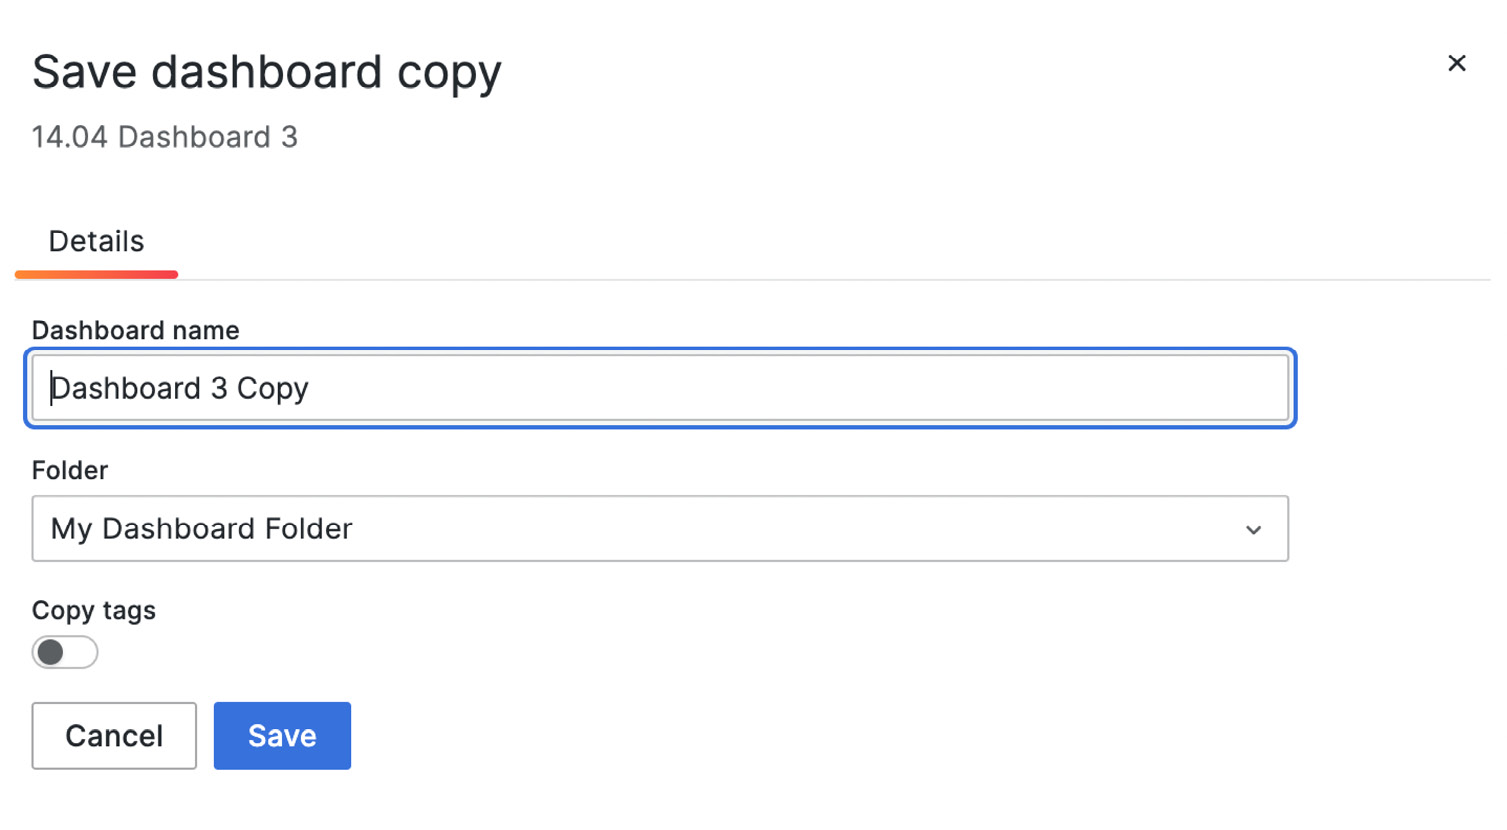
Figure 14.19 – Copying a dashboard

Figure 14.19 – Copying a dashboard

  1. Click...
lock icon The rest of the chapter is locked
Register for a free Packt account to unlock a world of extra content!
A free Packt account unlocks extra newsletters, articles, discounted offers, and much more. Start advancing your knowledge today.
Unlock this book and the full library FREE for 7 days
Get unlimited access to 7000+ expert-authored eBooks and videos courses covering every tech area you can think of
Renews at $19.99/month. Cancel anytime
Banner background image