Search icon CANCEL
Subscription
0
Cart icon
Cart
Close icon
You have no products in your basket yet
Save more on your purchases!
Savings automatically calculated. No voucher code required
Arrow left icon
All Products
Best Sellers
New Releases
Books
Videos
Audiobooks
Learning Hub
Newsletters
Free Learning
Arrow right icon
Arrow up icon
GO TO TOP
Hands-On Neural Network Programming with C#

You're reading from  Hands-On Neural Network Programming with C#

Product type Book
Published in Sep 2018
Publisher Packt
ISBN-13 9781789612011
Pages 328 pages
Edition 1st Edition
Languages
Author (1):
Matt Cole Matt Cole
Profile icon Matt Cole

Table of Contents (16) Chapters

Preface 1. A Quick Refresher 2. Building Our First Neural Network Together 3. Decision Trees and Random Forests 4. Face and Motion Detection 5. Training CNNs Using ConvNetSharp 6. Training Autoencoders Using RNNSharp 7. Replacing Back Propagation with PSO 8. Function Optimizations: How and Why 9. Finding Optimal Parameters 10. Object Detection with TensorFlowSharp 11. Time Series Prediction and LSTM Using CNTK 12. GRUs Compared to LSTMs, RNNs, and Feedforward networks 13. Activation Function Timings
14. Function Optimization Reference 15. Other Books You May Enjoy

Understanding activation functions

An activation function is added to the output end of a neural network to determine the output. It usually will map the resultant values somewhere in the range of -1 to 1, depending upon the function. It is ultimately used to determine whether a neuron will fire or activate, as in a light bulb going on or off.

The activation function is the last piece of the network before the output and could be considered the supplier of the output value. There are many kinds of activation function that can be used, and this diagram highlights just a very small subset of these:

There are two types of activation function—linear and non-linear:

  • Linear: A linear function is that which is on, or nearly on, a straight line, as depicted here:
  • Non-linear: A non-linear function is that which is not on a straight line, as depicted here:

Visual activation function plotting

When dealing with activation functions, it is important that you visually understand what an activation function looks like before you use it. We are going to plot, and then benchmark, several activation functions for you to see:

This is what the logistic steep approximation and Swish activation function look like when they are plotted individually. As there are many types of activation function, the following shows what all our activation functions are going to look like when they are plotted together:

Note: You can download the program that produces the previous output from the SharpNeat project on GitHub https://github.com/colgreen/sharpneat.

At this point, you may be wondering why we even care what the plots look like—great point. We care because you are going to be using these quite a bit once you progress to hands-on experience, as you dive deeper into neural networks. It's very handy to be able to know whether your activation function will place the value of your neuron in the on or off state, and what range it will keep or need the values in. You will no doubt encounter and/or use activation functions in your career as a machine-learning developer, and knowing the difference between a Tanh and a LeakyRelu activation function is very important.

Function plotting

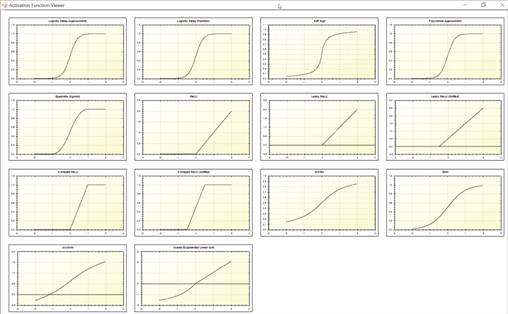
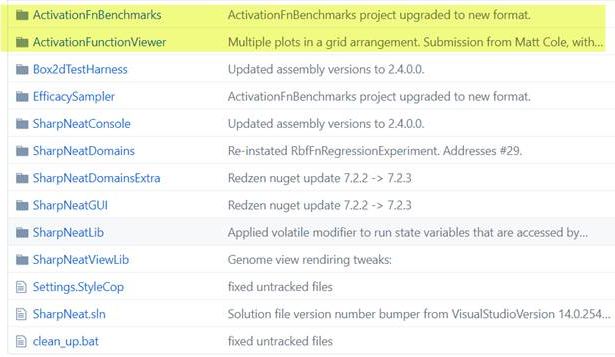
For this example, we are going to use the open source package SharpNeat. It is one of the most powerful machine- learning platforms anywhere, and it has a special activation function plotter included with it. You can find the latest version of SharpNeat at https://github.com/colgreen/sharpneat. For this example, we will use the ActivationFunctionViewer project included as shown:

Once you have that project open, search for the PlotAllFunctions function. It is this function that handles the plotting of all the activation functions as previously shown. Let's go over this function in detail:

private void PlotAllFunctions()
{
Clear everything out.
MasterPane master = zed.MasterPane;
master.PaneList.Clear();
master.Title.IsVisible = true;
master.Margin.All = 10;

Here is the section that will plot each individual function.
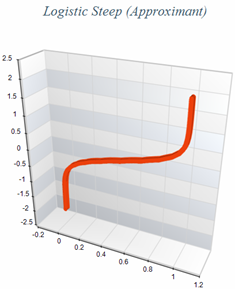
PlotOnMasterPane(Functions.LogisticApproximantSteep, "Logistic
Steep (Approximant)");

PlotOnMasterPane(Functions.LogisticFunctionSteep, "Logistic Steep
(Function)");

PlotOnMasterPane(Functions.SoftSign, "Soft Sign");

PlotOnMasterPane(Functions.PolynomialApproximant, "Polynomial
Approximant");

PlotOnMasterPane(Functions.QuadraticSigmoid, "Quadratic Sigmoid");

PlotOnMasterPane(Functions.ReLU, "ReLU");

PlotOnMasterPane(Functions.LeakyReLU, "Leaky ReLU");

PlotOnMasterPane(Functions.LeakyReLUShifted, "Leaky ReLU
(Shifted)");

PlotOnMasterPane(Functions.SReLU, "S-Shaped ReLU");

PlotOnMasterPane(Functions.SReLUShifted, "S-Shaped ReLU
(Shifted)");

PlotOnMasterPane(Functions.ArcTan, "ArcTan");

PlotOnMasterPane(Functions.TanH, "TanH");

PlotOnMasterPane(Functions.ArcSinH, "ArcSinH");

PlotOnMasterPane(Functions.ScaledELU, "Scaled Exponential Linear
Unit");

Reconfigure the Axis
zed.AxisChange();

Layout the graph panes using a default layout
using (Graphics g = this.CreateGraphics())
{
master.SetLayout(g, PaneLayout.SquareColPreferred);
}

MainPlot Function

Behind the scenes, the ‘Plot' function is what is responsible for
executing and plotting each function.

private void Plot(Func<double, double> fn, string fnName, Color
graphColor, GraphPane gpane = null)
{
const double xmin = -2.0;
const double xmax = 2.0;
const int resolution = 2000;
zed.IsShowPointValues = true;
zed.PointValueFormat = "e";

var pane = gpane ?? zed.GraphPane;
pane.XAxis.MajorGrid.IsVisible = true;
pane.YAxis.MajorGrid.IsVisible = true;
pane.Title.Text = fnName;
pane.YAxis.Title.Text = string.Empty;
pane.XAxis.Title.Text = string.Empty;

double[] xarr = new double[resolution];
double[] yarr = new double[resolution];
double incr = (xmax - xmin) / resolution;
doublex = xmin;

for(int i=0; i<resolution; i++, x += incr)
{
xarr[i] = x;
yarr[i] = fn(x);
}

PointPairList list1 = new PointPairList(xarr, yarr);
LineItem li = pane.AddCurve(string.Empty, list1, graphColor,
SymbolType.None);
li.Symbol.Fill = new Fill(Color.White);
pane.Chart.Fill = new Fill(Color.White,
Color.LightGoldenrodYellow, 45.0F);
}

The main point of interest from the earlier code is highlighted in yellow. This is where the activation function that we passed in gets executed and its value used for the y axis plot value. The famous ZedGraph open source plotting package is used for all graph plotting. Once each function is executed, the respective plot will be made.

You have been reading a chapter from
Hands-On Neural Network Programming with C#
Published in: Sep 2018 Publisher: Packt ISBN-13: 9781789612011
Register for a free Packt account to unlock a world of extra content!
A free Packt account unlocks extra newsletters, articles, discounted offers, and much more. Start advancing your knowledge today.
Unlock this book and the full library FREE for 7 days
Get unlimited access to 7000+ expert-authored eBooks and videos courses covering every tech area you can think of
Renews at €14.99/month. Cancel anytime}