The C++ profiler is extremely useful for finding sections of code that require a high amount of processing time. Using the profiler can help you find sections of code to focus on during optimization. If you suspect that a region of code runs slowly, then you can actually confirm that it isn't slow if it doesn't appear highlighted in the profiler.
Using the profiler to identify hot spots
How to do it...
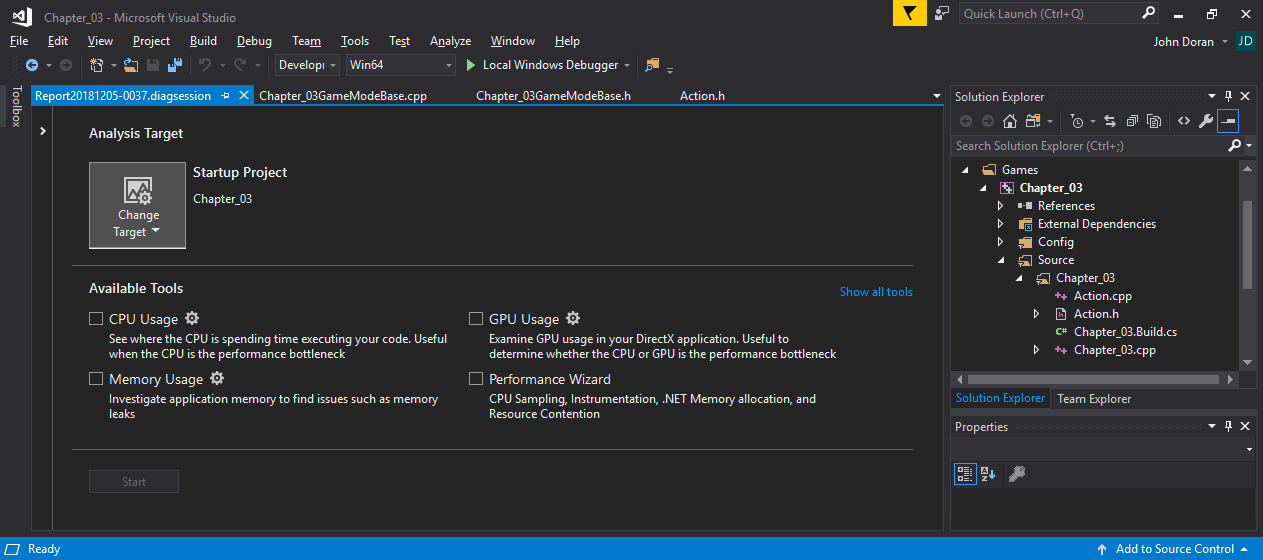
- Go to Debug | Performance Profiler...:

- In the dialog shown in the preceding screenshot, select the type of analysis you'd like displayed. You can choose to analyze CPU Usage, GPU Usage, Memory Usage, or step through a Performance Wizard to assist you in selecting what you want to see.
- Make sure to run the...


