In this section, we will learn about the Visual Studio for Mac built-in debugger and how we can use this debugging tool to step through our code and debug our PlanetaryApp. You'll also learn how to work with and use the Immediate window to print out the contents of your code variables.
Using the Visual Studio for Mac built-in debugger
Overview of the Visual Studio for Mac debugger
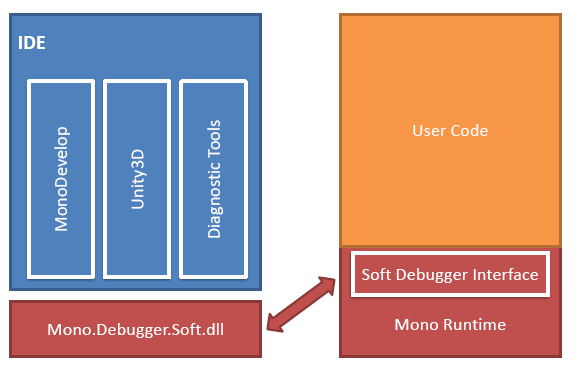
Visual Studio for Mac includes a built-in native debugger that provides debugging support for your iOS, Android, UWP, and Mac applications. The Visual Studio for Mac IDE uses the Mono Soft Debugger, which is a new debugging framework that has been implemented directly into the Mono Framework runtime.
Having this integrated directly into the Mono Framework runtime allows Visual Studio for Mac to debug your managed C# code across each of the different platforms, which can be seen in the following screenshot:
For more information on the Mono Soft Debugger, refer to http://www.mono-project.com/docs/advanced/runtime/docs/soft-debugger.
Using the debugger to step through your code
To start debugging any application, you will need to ensure that your configuration has been set to Debug, as can be seen in the following screenshot:

Setting this configuration provides you with a set of helpful tools that support debugging, such as Breakpoints, visualizing the contents of your variables, and viewing the call stack.
Once you have set the configuration for your project solution to Debug, you will need to ensure that you have set the target device or your iOS simulated device that you would like to use, which can be seen in the preceding screenshot.
To start debugging your application, follow these steps:
- Ensure that the MainPage.xaml.cs file is displayed in the code editor window.
- Next, deploy your application by pressing the Play button, or alternatively pressing command + Enter:
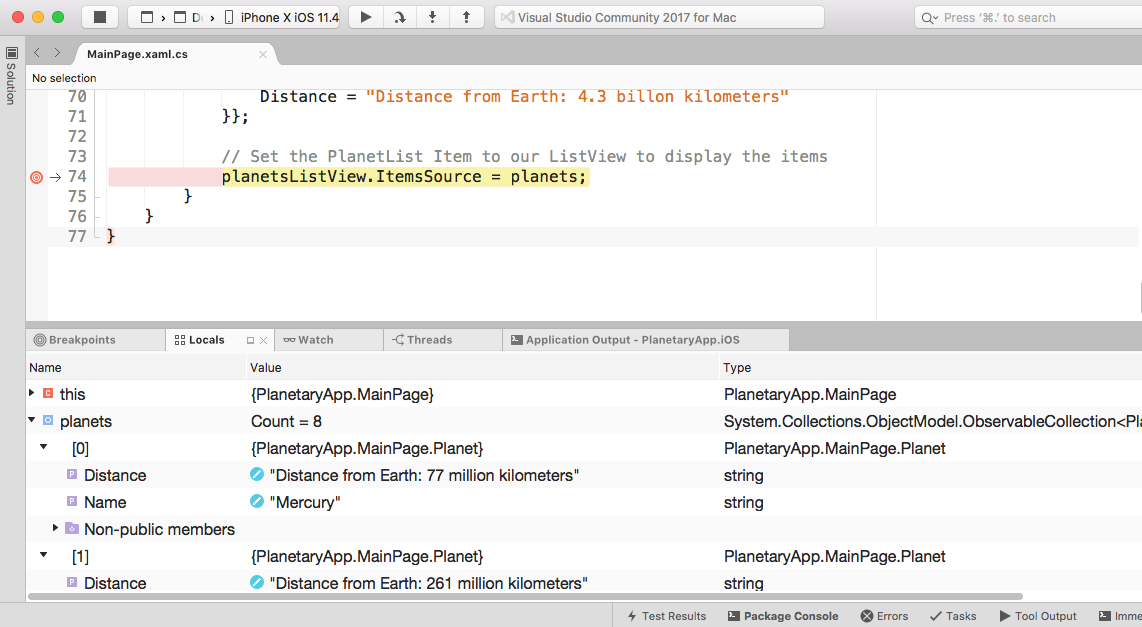
Whenever you hit a Breakpoint, your code will pause and the line will be highlighted in yellow, as can be seen in the preceding screenshot:

You will notice that the debugging tools will appear in the Visual Studio for Mac IDE and consist of four buttons that allow you to run and step through your code.
The following table provides a list of each of the debugging tool buttons, as well as a brief description:
|
Debugging button |
Description |
|
Play |
When this button is pressed, it will begin executing the code until the next breakpoint is reached. |
|
Step Over |
When this button is pressed, it will execute the next line of code. If the next line is a function call, the Step Over button will execute the code contained in the function, and will then stop at the next line of code after the function call. |
|
Step Into |
When this button is pressed, it will execute the next line of code, and if it is determined that the next line is a function call, the Step Into button will stop at the first line of the function. This will allow you to continue line-by-line debugging of the function. Alternatively, if the next line is not a function, it will behave in the same way as the Step Over button. |
|
Step Out |
When this button is pressed, it will return to the line where the current function was called. |
Now that you have an overview of the Visual Studio for Mac built-in debugger and how you can use the debugger to step through your code by using each of the four buttons, our next step is to take a look at how we can use the Immediate window to print the contents of your code variables, which we will be covering in the next section.
Using the Immediate window to print code variable contents
You can also use the Visual Studio for Mac built-in debugger to investigate and analyze the content of your code variables whenever a Breakpoint is reached. In this section, we will learn how to use the Immediate window to analyze the content of code variables.
To display the Immediate window, follow the steps outlined here:
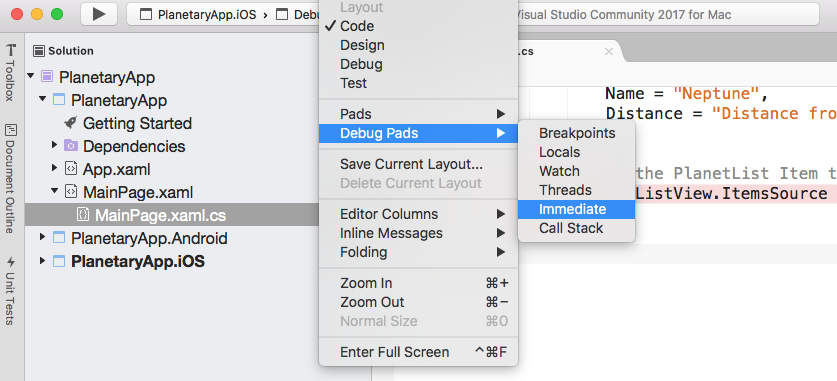
- Ensure that the MainPage.xaml.cs file is displayed in the code editor window and choose the View|Debug Pads|Immediate menu option:
- You will then see the Immediate window displayed, as can be seen in the following screenshot:
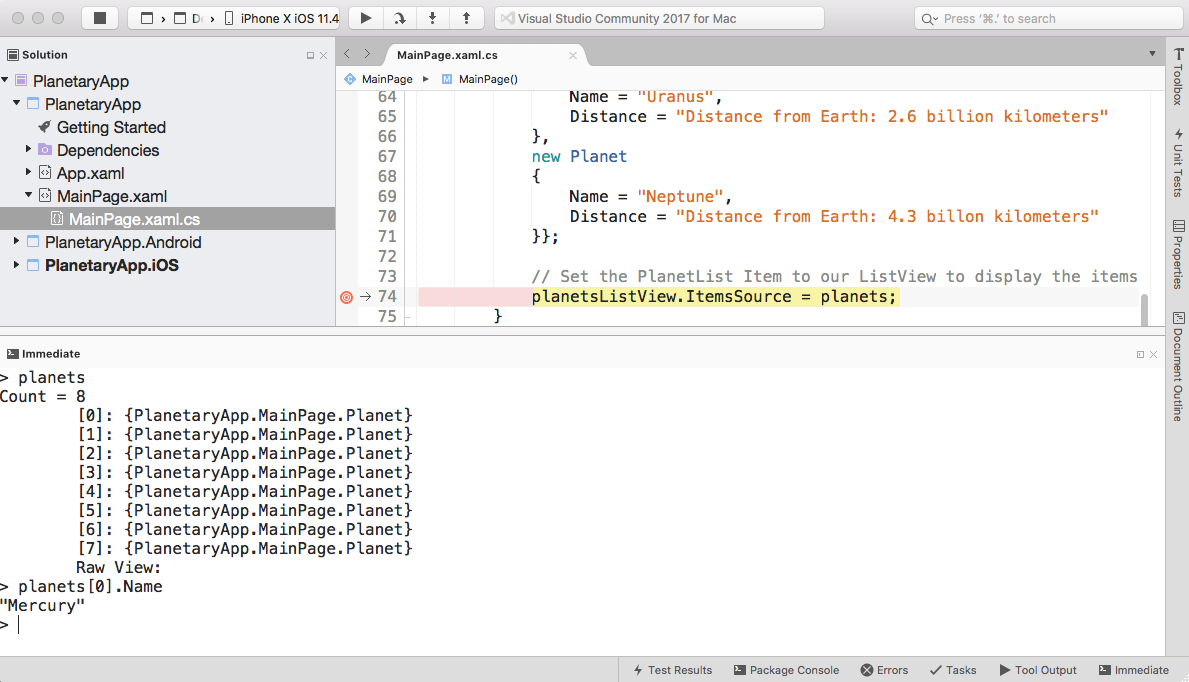
As you can see in the preceding screenshot, you can see the contents of the planets variable by simply typing the name of the variable in the Immediate window. Since our planets variable is a collection, you can reference properties of the collection. Also, in the Immediate window you can change the contents of any item in the collection.


