Using Show Me
Show Me is a powerful component of Tableau that arranges selected and active fields into the places required for the selected visualization type. The Show Me toolbar displays small thumbnail images of different types of visualizations, allowing you to create visualizations with a single click. Based on the fields you select in the Data pane and the fields that are already in view, Show Me will enable possible visualizations and highlight a recommended visualization.
It does this with visual analytics best practices built in, giving you the ability to quickly see a variety of visualizations that might answer your questions.
Explore the features of Show Me by following these steps:
- Navigate to the Show Me sheet.
- If the Show Me pane is not expanded, click on the Show Me button in the upper right of the toolbar to expand the pane.
- Press and hold the Ctrl key while clicking on the
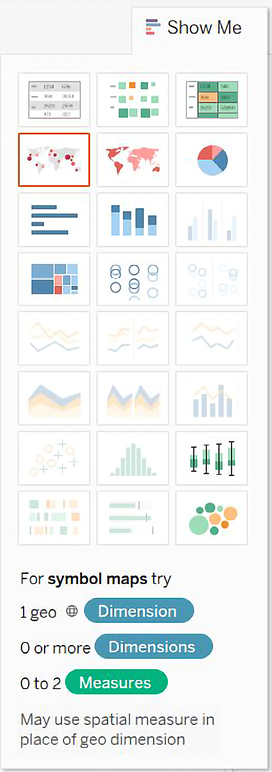
Postal Code,State, andProfitfields in the Data pane to select each of those fields. With those fields highlighted, Show Me should look like this:

Figure 1.25: The Show Me interface
Notice that the Show Me window has enabled certain visualization types such as text tables, heat maps, symbol maps, filled maps, and bar charts. These are the visualizations that are possible given the fields already in the view, in addition to any selected in the Data pane.
Show Me highlights the recommended visualization for the selected fields and gives a description of what fields are required as you hover over each visualization type. Symbol maps, for example, require one geographic dimension and 0 to 2 measures.
Other visualizations are grayed out, such as lines, area charts, and histograms. Show Me will not create these visualization types with the fields that are currently in the view and are selected in the Data pane. Hover over the grayed-out line charts option in Show Me. It indicates that line charts require one or more measures (which you have selected) but also require a date field (which you have not selected).
Tableau will draw line charts with fields other than dates. Show Me gives you options for what is typically considered good practice for visualizations. However, there may be times when you know that a line chart would represent your data better. Understanding how Tableau renders visualizations based on fields and shelves instead of always relying on Show Me will give you much greater flexibility in your visualizations and will allow you to rearrange things when Show Me doesn’t give you the exact results you want. At the same time, you will need to cultivate an awareness of good visualization practices.
Show Me can be a powerful way in which to quickly iterate through different visualization types as you search for insights into the data. But as a data explorer, analyst, and storyteller, you should consider Show Me as a helpful guide that gives suggestions. You may know that a certain visualization type will answer your questions more effectively than the suggestions of Show Me. You also may have a plan for a visualization type that will work well as part of a dashboard but isn’t even included in Show Me.
You will be well on your way to learning and mastering Tableau when you can use Show Me effectively but feel just as comfortable building visualizations without it. Show Me is powerful for quickly iterating through visualizations as you look for insights and raise new questions. It is useful for starting with a standard visualization that you will further customize. It is wonderful as a teaching and learning tool.
However, be careful to not use it as a crutch without understanding how visualizations are actually built from the data. Take the time to evaluate why certain visualizations are or are not possible. Pause to see what fields and shelves were used when you selected a certain visualization type.
End the example by experimenting with Show Me by clicking on various visualization types, looking for insights into the data that may be more or less obvious based on the visualization type. Circle views and box-and-whisker plots show the distribution of postal codes for each state. Bar charts easily expose several postal codes with negative profit.
Now that you have become familiar with creating individual views of the data, let’s turn our attention to putting it all together in a dashboard.


