Search icon CANCEL
Subscription
0
Cart icon
Your Cart (0 item)
Close icon
You have no products in your basket yet
Arrow left icon
Explore Products
Best Sellers
New Releases
Books
Videos
Audiobooks
Learning Hub
Conferences
Free Learning
Arrow right icon
Arrow up icon
GO TO TOP
Learning Elastic Stack 7.0

You're reading from   Learning Elastic Stack 7.0 Distributed search, analytics, and visualization using Elasticsearch, Logstash, Beats, and Kibana

Arrow left icon
Product type Paperback
Published in May 2019
Publisher Packt
ISBN-13 9781789954395
Length 474 pages
Edition 2nd Edition
Arrow right icon
Authors (2):
Arrow left icon
Sharath Kumar Sharath Kumar
Author Profile Icon Sharath Kumar
Sharath Kumar
Pranav Shukla Pranav Shukla
Author Profile Icon Pranav Shukla
Pranav Shukla
Arrow right icon
View More author details
Toc

Table of Contents (17) Chapters Close

Preface 1. Section 1: Introduction to Elastic Stack and Elasticsearch FREE CHAPTER
2. Introducing Elastic Stack 3. Getting Started with Elasticsearch 4. Section 2: Analytics and Visualizing Data
5. Searching - What is Relevant 6. Analytics with Elasticsearch 7. Analyzing Log Data 8. Building Data Pipelines with Logstash 9. Visualizing Data with Kibana 10. Section 3: Elastic Stack Extensions
11. Elastic X-Pack 12. Section 4: Production and Server Infrastructure
13. Running Elastic Stack in Production 14. Building a Sensor Data Analytics Application 15. Monitoring Server Infrastructure 16. Other Books You May Enjoy

Deployment architecture

The following diagram depicts the commonly used Elastic Stack deployment architecture:
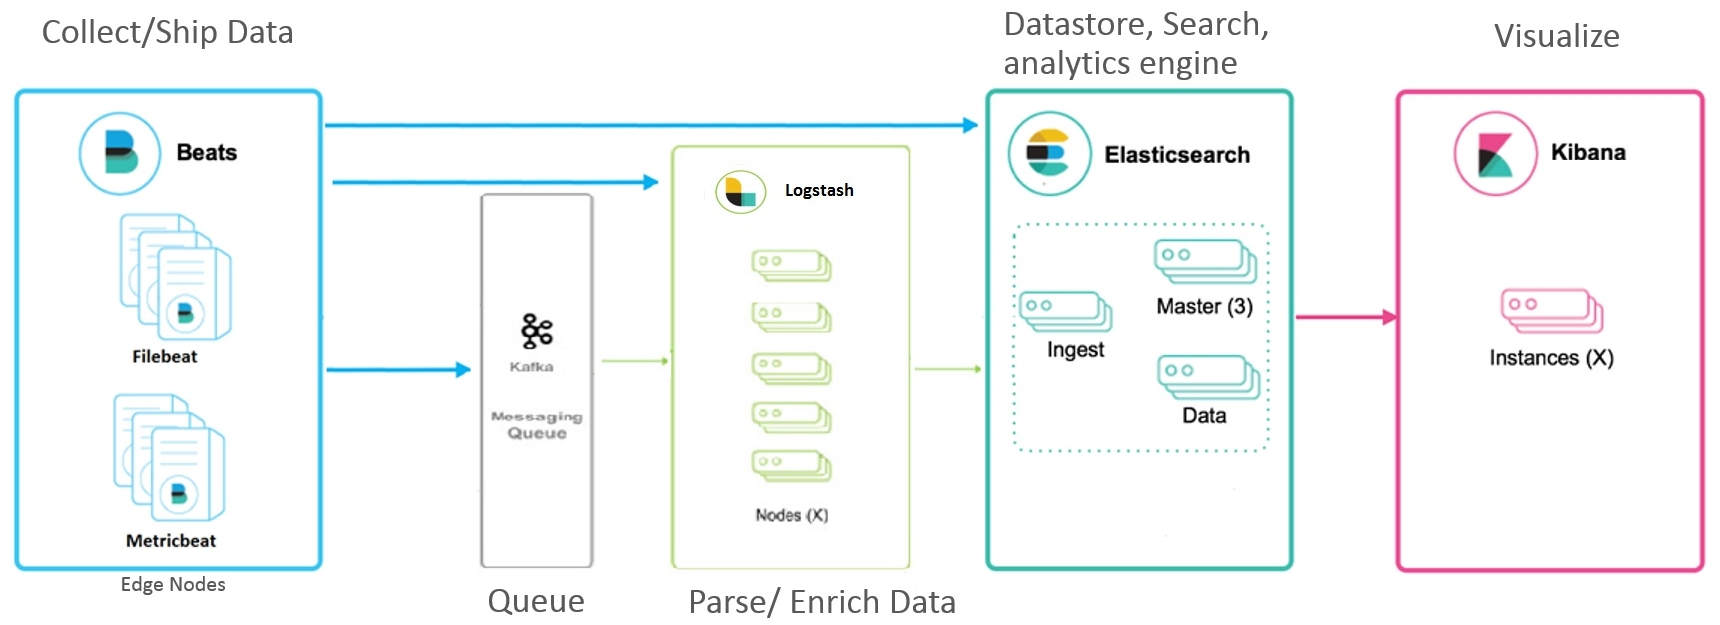
This diagram depicts three possible architectures:

  • Ship the operation metrics directly to Elasticsearch: As seen in the preceding diagram, you will install various types of Beats, such as Metricbeat, Filebeat, Packetbeat, and so on, on the edge servers from which you would like to ship the operation metrics/logs. If no further processing is required, then the generated events can be shipped directly to the Elasticsearch cluster. Once the data is present in Elasticsearch, it can then be visualized/analyzed using Kibana. In this architecture, the flow of events would be Beats → Elasticsearch → Kibana.
  • Ship the operation metrics to Logstash: The operation metrics/logs that are captured by Beats and installed on edge servers is sent to Logstash for further...
lock icon The rest of the chapter is locked
Register for a free Packt account to unlock a world of extra content!
A free Packt account unlocks extra newsletters, articles, discounted offers, and much more. Start advancing your knowledge today.
Unlock this book and the full library FREE for 7 days
Get unlimited access to 7000+ expert-authored eBooks and videos courses covering every tech area you can think of
Renews at $19.99/month. Cancel anytime
Banner background image