


Variance
The mean and the median are two alternative ways of describing the middle value of a sequence, but on their own they tell you very little about the values contained within it. For example, if we know the mean of a sequence of ninety-nine values is 50, we can still say very little about what values the sequence contains.
It may contain all the integers from one to ninety-nine, or forty-nine zeros and fifty ninety-nines. Maybe it contains negative one ninety-eight times and a single five-thousand and forty-eight. Or perhaps all the values are exactly fifty.
The variance of a sequence is its "spread" about the mean, and each of the preceding examples would have a different variance. In mathematical notation, the variance is expressed as:
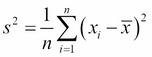
where s2 is the mathematical symbol often used to denote the variance.
This equation bears a number of similarities to the equation for the mean calculated previously. Instead of summing a single value, xi, we are summing a function of  . Recall that the symbol
  represents the mean value, so the function calculates the squared deviation of xi from the mean of all the xs.
We can turn the expression into a function, square-deviation, that we map over the sequence of xs. We can also make use of the mean function we've already created to sum the values in the sequence and divide by the count.
(defn variance [xs]
  (let [x-bar (mean xs)
        n     (count xs)
        square-deviation (fn [x]
                           (i/sq (- x x-bar)))]
    (mean (map square-deviation xs))))
We're using Incanter's i/sq function to calculate the square of our expression.
Since we've squared the deviation before taking the mean, the units of variance are also squared, so the units of the variance of the UK electorate are "people squared". This is somewhat unnatural to reason about. We can make the units more natural by taking the square root of the variance so the units are "people" again, and the result is called the standard deviation:
(defn standard-deviation [xs]
  (i/sqrt (variance xs)))

(defn ex-1-9 []
  (->> (load-data :uk-scrubbed)
       (i/$ "Electorate")
       (standard-deviation)))

;; 7672.77
Incanter's implements functions to calculate the variance and standard deviation as s/variance and s/sd respectively.


