Workspace window
In this recipe, we are going to go over the ZAP Proxy workspace window and what each section of the workspace window does.
Getting ready
For you to be able to go over this recipe, you will need to have ZAP installed on your computer and also should have it started and running.
How to do it…
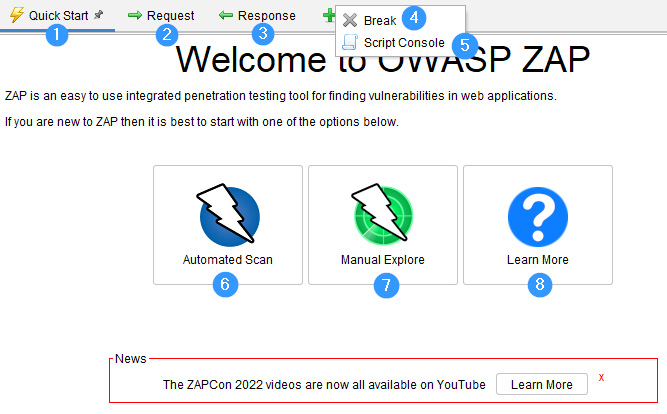
In the workspace section of ZAP proxy, you will be able to view requests and responses as well as start scans. The numbers in the following points correspond with the labels in Figure 2.12:
- Quick Start (1): Quick Start shows you a window that allows you to choose whether to start an automated scan or use the manual explorer
- Request and Response tabs (2 and 3): The Request and Response tabs allow you to view the requests and responses from your site sections
- Break (4): The Break tab allows you to change a request and response stop by ZAP breakpoint
- Script Console (5): The Script Console tab opens a window that allows you to modify a newly created script
- Automated Scan (6): The Automated Scan option allows you to start an automated scan on a target
- Manual Explore (7): The Manual Explore option allows you to launch a browser window with a target that has all the settings set up to proxy a target through ZAP
- Learn More (8): The Learn More option gives you details about ZAP and provides links that require the internet to get more detailed information

Figure 2.12 – The Workspace window
How it works…
This window kicks off the entire project and is the main feature presented in OWASP ZAP for testing. Unlike other machine-in-the-middle proxying tools, the assessment is captured using this window, whether automated or manually. The content gets populated from here into the information window. We’ll discuss, in the upcoming section, what information this window contains, other tabs or add-ons, and how these can be configured.


