Search icon CANCEL
Subscription
0
Cart icon
Your Cart (0 item)
Close icon
You have no products in your basket yet
Save more on your purchases! discount-offer-chevron-icon
Savings automatically calculated. No voucher code required.
Arrow left icon
Explore Products
Best Sellers
New Releases
Books
Videos
Audiobooks
Learning Hub
Free Learning
Arrow right icon
Arrow up icon
GO TO TOP
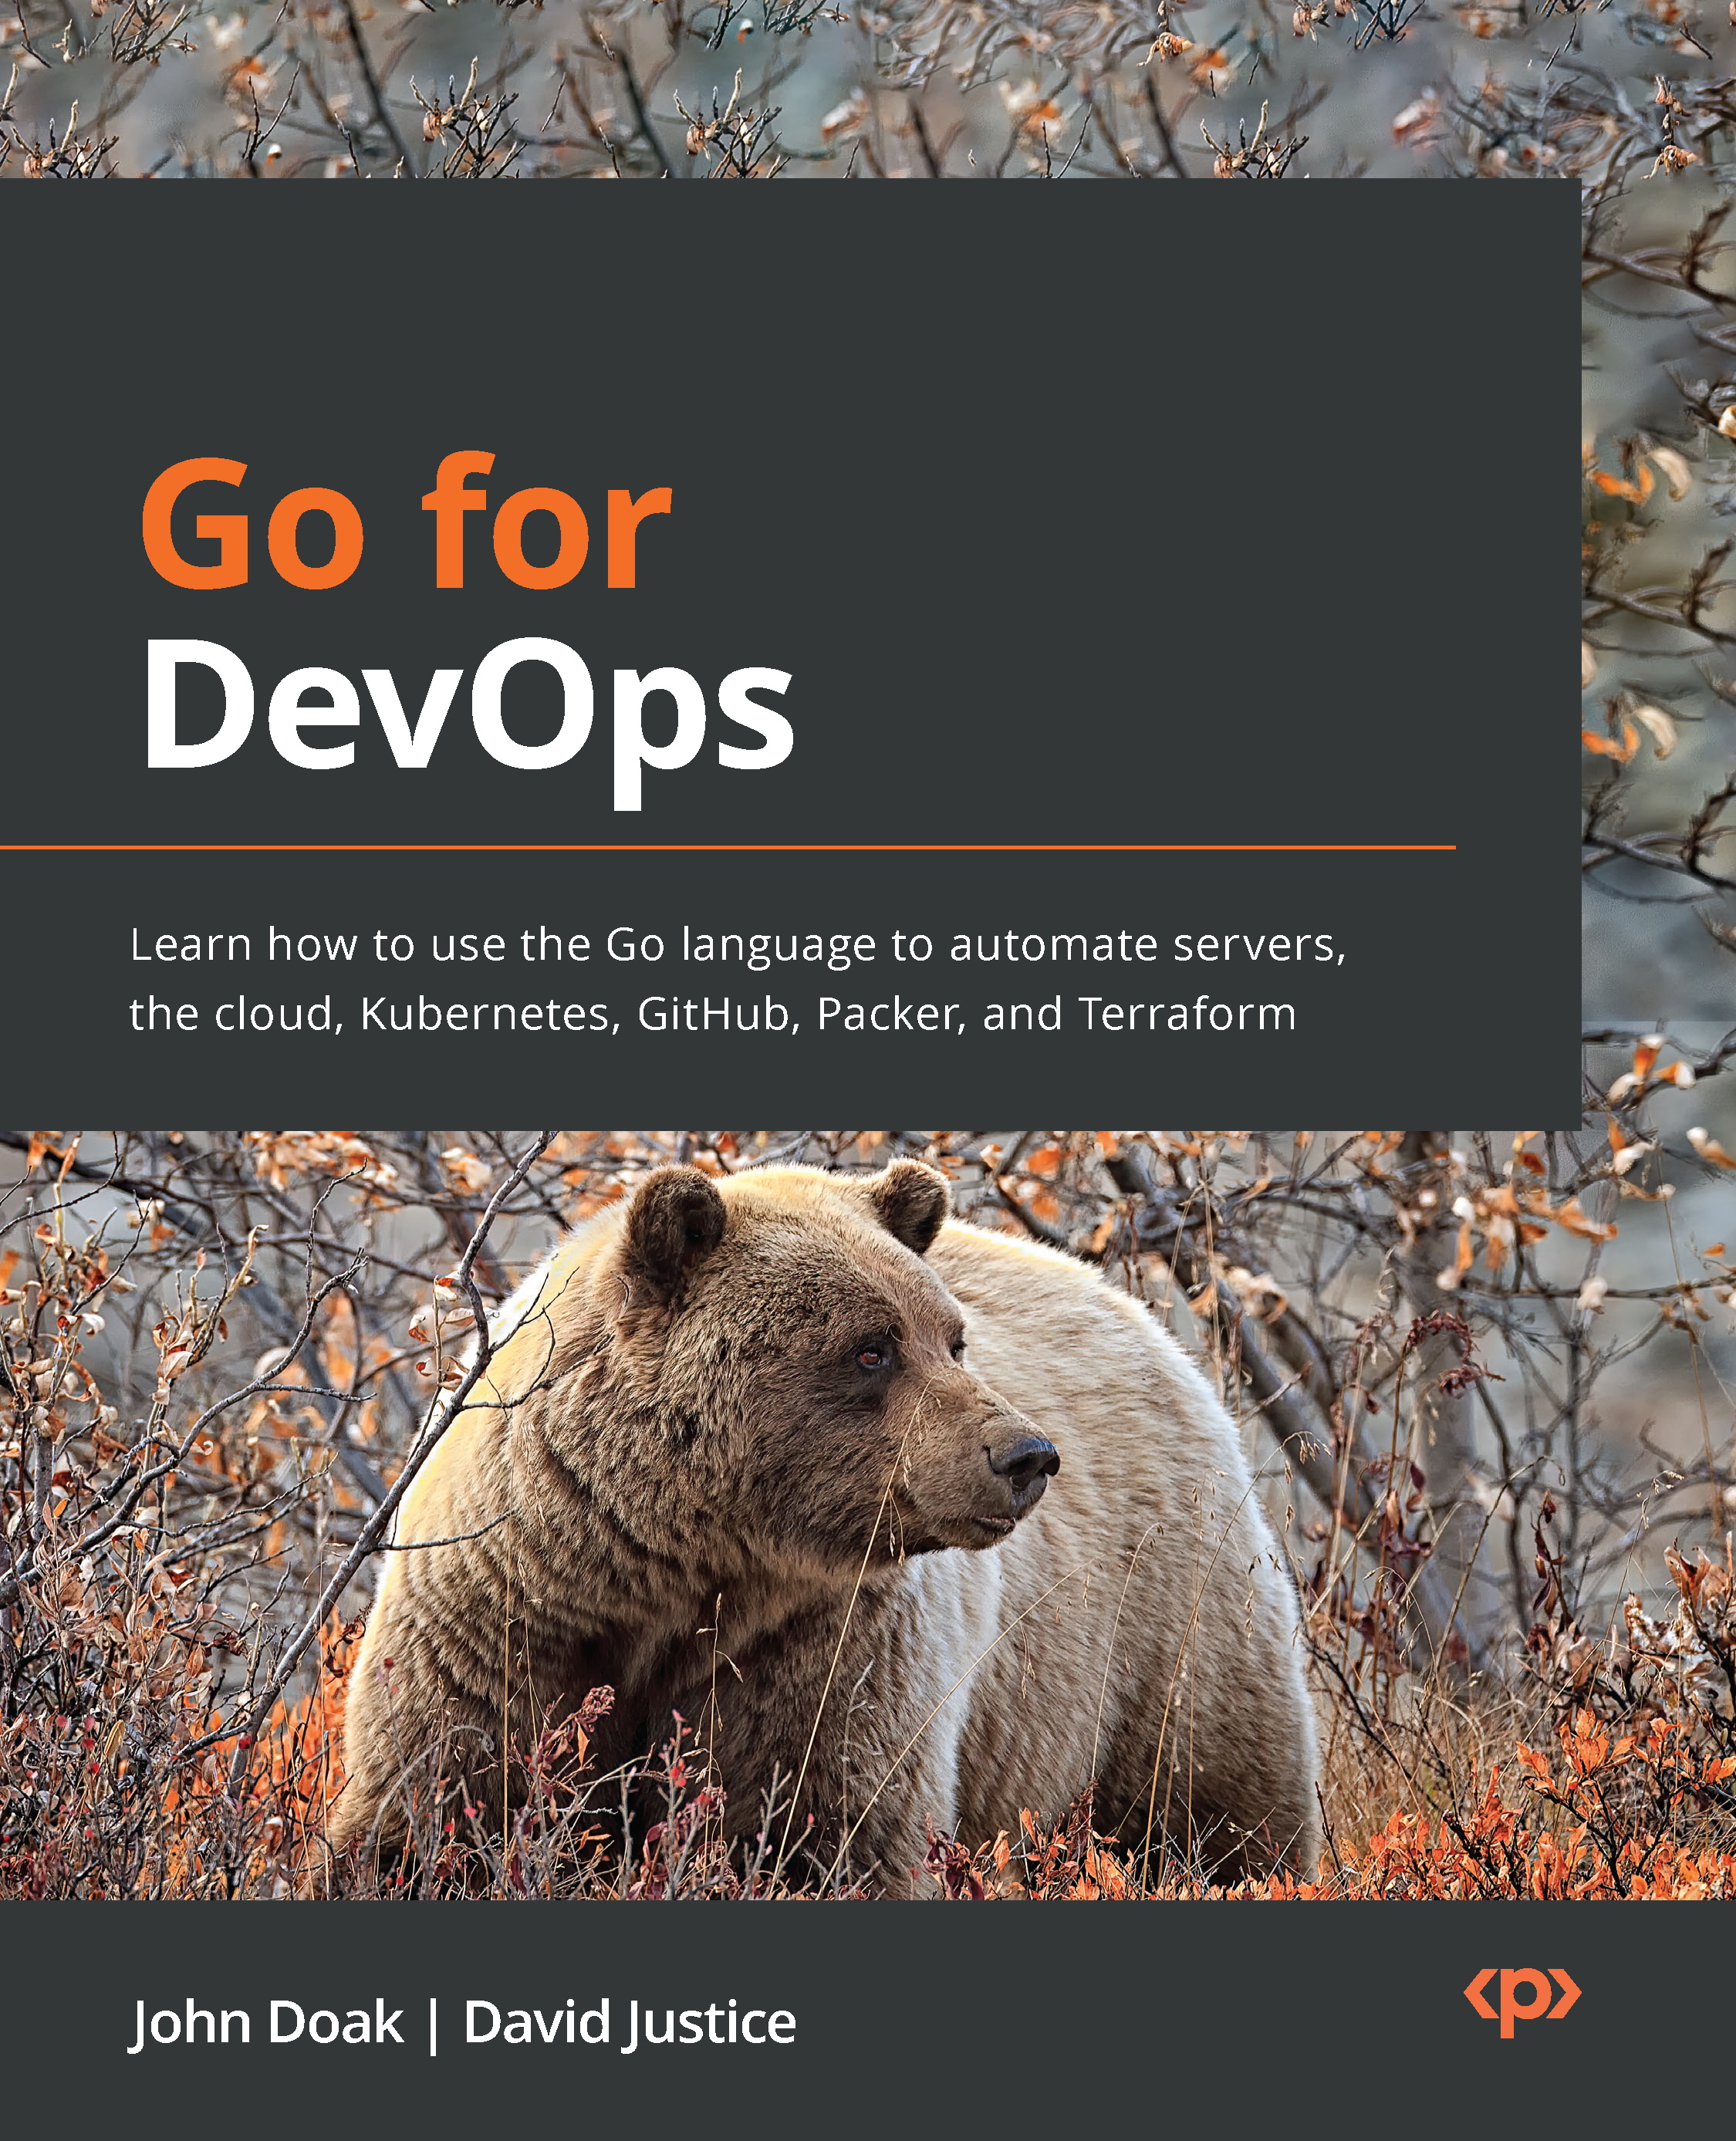
Go for DevOps

You're reading from   Go for DevOps Learn how to use the Go language to automate servers, the cloud, Kubernetes, GitHub, Packer, and Terraform

Arrow left icon
Product type Paperback
Published in Jul 2022
Publisher Packt
ISBN-13 9781801818896
Length 634 pages
Edition 1st Edition
Languages
Tools
Concepts
Arrow right icon
Authors (2):
Arrow left icon
John Doak John Doak
Author Profile Icon John Doak
John Doak
David Justice David Justice
Author Profile Icon David Justice
David Justice
Arrow right icon
View More author details
Toc

Table of Contents (22) Chapters Close

Preface 1. Section 1: Getting Up and Running with Go
2. Chapter 1: Go Language Basics FREE CHAPTER 3. Chapter 2: Go Language Essentials 4. Chapter 3: Setting Up Your Environment 5. Chapter 4: Filesystem Interactions 6. Chapter 5: Using Common Data Formats 7. Chapter 6: Interacting with Remote Data Sources 8. Chapter 7: Writing Command-Line Tooling 9. Chapter 8: Automating Command-Line Tasks 10. Section 2: Instrumenting, Observing, and Responding
11. Chapter 9: Observability with OpenTelemetry 12. Chapter 10: Automating Workflows with GitHub Actions 13. Chapter 11: Using ChatOps to Increase Efficiency 14. Section 3: Cloud ready Go
15. Chapter 12: Creating Immutable Infrastructure Using Packer 16. Chapter 13: Infrastructure as Code with Terraform 17. Chapter 14: Deploying and Building Applications in Kubernetes 18. Chapter 15: Programming the Cloud 19. Chapter 16: Designing for Chaos 20. Index 21. Other Books You May Enjoy

Summary

In this chapter, we explored the basics of OpenTelemetry, how to instrument your applications and infrastructure, and how to export that telemetry into backend visualization and analysis tools such as Jaeger and Prometheus. We also extended the benefits of metrics by integrating alerting rules to proactively notify us when an application is operating outside of expected behavioral parameters. With the application of what you have learned, you will never be caught blind during a support call. You will have the data to diagnose and resolve issues in your complex system. Better yet, you will know about these problems before issues are raised by your customers.

We also established some relatively simple metrics, traces, and alerts. With this knowledge, you will be able to implement your own traces, metrics, and alerts to empower you and your team to react quickly and efficiently to failures in production.

In the next chapter, we will discuss how to automate workflows with...

lock icon The rest of the chapter is locked
Register for a free Packt account to unlock a world of extra content!
A free Packt account unlocks extra newsletters, articles, discounted offers, and much more. Start advancing your knowledge today.
Unlock this book and the full library FREE for 7 days
Get unlimited access to 7000+ expert-authored eBooks and videos courses covering every tech area you can think of
Renews at $19.99/month. Cancel anytime
Banner background image