Version three – navigation bar
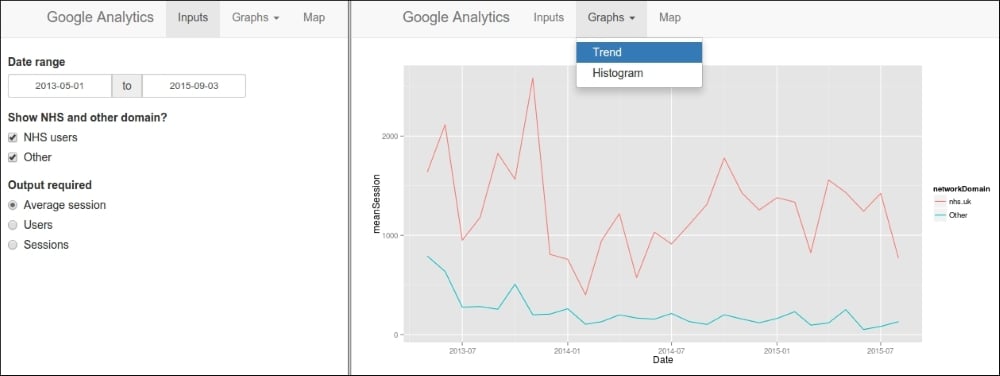
Larger, more complex applications can be organized using a navigation bar along the top of the screen. The application we will look at is relatively simple to avoid generating too much code, but hopefully by the end of this section, you will be able to easily see how simple it is to organize a lot of UI elements in this way. The finished application is as follows:

Two states of the application are shown; the inputs are shown on the first tab, and the graphs are stored in a menu in the second tab (menu pictured), and the map is shown on the final tab.
The server.R file is again unchanged except that the map drawing function that we saw in Chapter 2, Building Your First Application, has been put back in.
ui.R
Let's again look at the ui.R file:
shinyUI(
  navbarPage("Google Analytics",
The page is set up by using navbarPage() instead of fluidPage() and a title for the application passed in:
    tabPanel("Inputs",
      dateRangeInput(inputId = "dateRange",
        label...


