Visualization with displaCy
Visualization is an important tool that should be in every data scientist's toolbox. Visualization is the easiest way to explain some concepts to your colleagues, your boss, and any technical or non-technical audience. Visualization of language data is specifically useful and allows you to identify patterns in your data at a glance.
There are many Python libraries and plugins such as Matplotlib, seaborn, TensorBoard, and so on. Being an industrial library, spaCy comes with its own visualizer – displaCy. In this subsection, you'll learn how to spin up a displaCy server on your machine, in a Jupyter notebook, and in a web application. You'll also learn how to export the graphics you created as an image file, customize your visualizations, and make manual annotations without creating a Doc object. We'll start by exploring the easiest way – using displaCy's interactive demo.
Getting started with displaCy
Go ahead and navigate to https://explosion.ai/demos/displacy to use the interactive demo. Enter your text in the Text to parse box and then click the search icon on the right to generate the visualization. The result might look like the following:
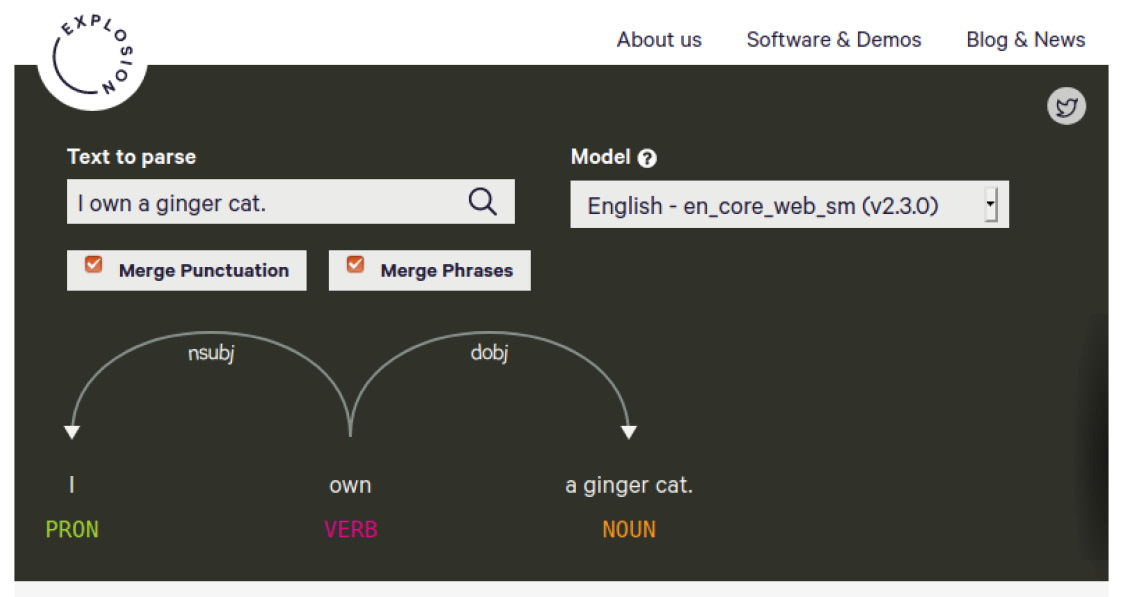
Figure 1.11 – displaCy's online demo
The visualizer performs two syntactic parses, POS tagging, and a dependency parse, on the submitted text to visualize the sentence's syntactic structure. Don't worry about how POS tagging and dependency parsing work, as we'll explore them in the upcoming chapters. For now, just think of the result as a sentence structure.
You'll notice two tick boxes, Merge Punctuation and Merge Phrases. Merging punctuation merges the punctuation tokens into the previous token and serves a more compact visualization (it works like a charm on long documents).
The second option, Merge Phrases, again gives more compact dependency trees. This option merges adjectives and nouns into one phrase; if you don't merge, then adjectives and nouns will be displayed individually. This feature is useful for visualizing long sentences with many noun phrases. Let's see the difference with an example sentence: They were beautiful and healthy kids with strong appetites. It contains two noun phrases, beautiful and healthy kids and strong appetite. If we merge them, the result is as follows:
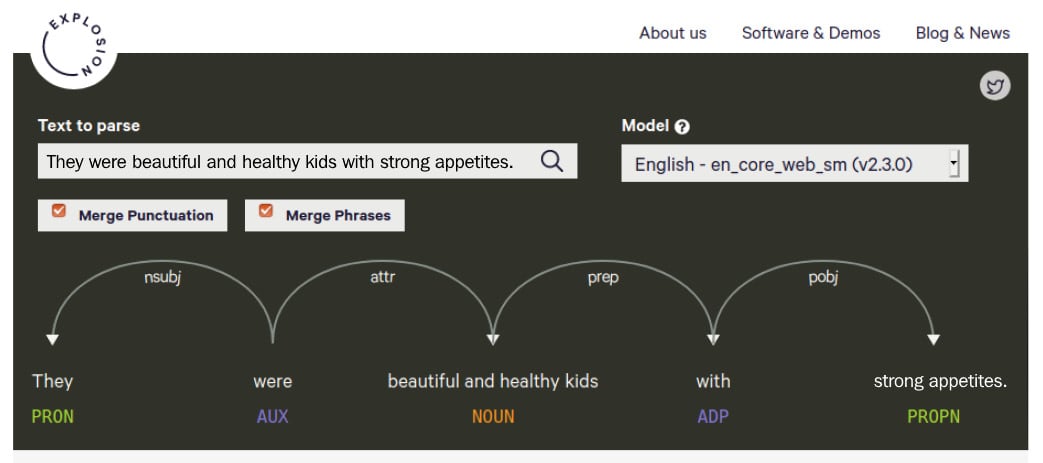
Figure 1.12 – An example parse with noun phrases merged
Without merging, every adjective and noun are shown individually:
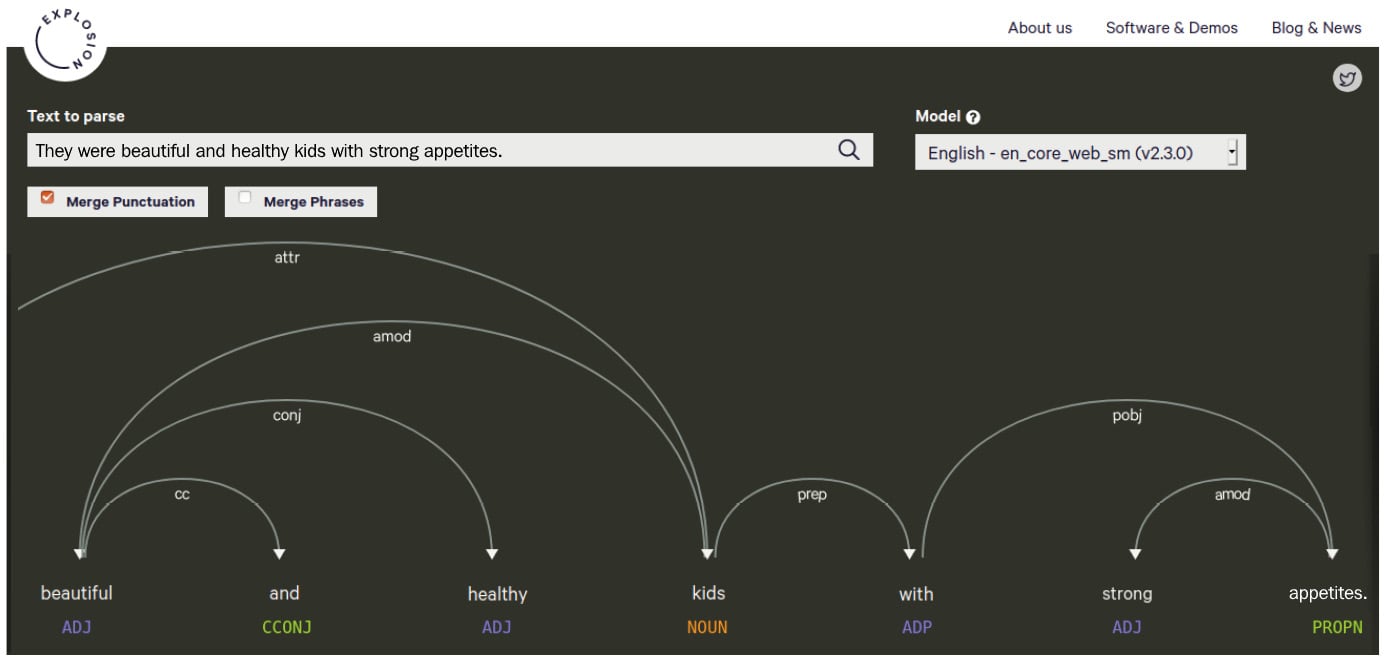
Figure 1.13 – A parse of the same sentence, unmerged
The second parse is a bit too cumbersome and difficult to read. If you work on a text with long sentences such as law articles or Wikipedia entries, we definitely recommend merging.
You can choose a statistical model from the Model box on the right for the currently supported languages. This option allows you to play around with the language models without having to download and install them on your local machine.
Entity visualizer
displaCy's entity visualizer highlights the named entities in your text. The online demo lives at https://explosion.ai/demos/displacy-ent/. We didn't go through named entities yet, but you can think of them as proper nouns for important entities such as people's names, company names, dates, city and country names, and so on. Extracting entities will be covered in Chapter 3, Linguistic Features, and Chapter 4, Rule-Based Matching, in detail.
The online demo works similar to the syntactic parser demo. Enter your text into the textbox and hit the search button. Here is an example:
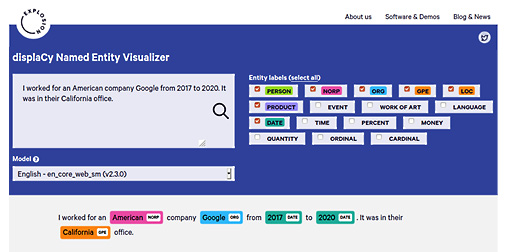
Figure 1.14 – An example entity visualization
The right side contains tick boxes for entity types. You can tick the boxes that match your text type such as, for instance, MONEY and QUANTITY for a financial text. Again, just like in the syntactic parser demo, you can choose from the available models.
Visualizing within Python
With the introduction of the latest version of spaCy, the displaCy visualizers are integrated into the core library. This means that you can start using displaCy immediately after installing spaCy on your machine! Let's go through some examples.
The following code segment is the easiest way to spin up displaCy on your local machine:
 import spacy
 from spacy import displacy
 nlp = spacy.load('en_core_web_md')
 doc= nlp('I own a ginger cat.')
 displacy.serve(doc, style='dep')
As you can see from the preceding snippet, the following is what we did:
- We import
spaCy. - Following that, we import
displaCyfrom the core library. - We load the English model that we downloaded in the Installing spaCy's statistical models section.
- Once it is loaded, we create a
Docobject to pass todisplaCy. - We then started the
displaCyweb server via callingserve(). - We also passed
depto thestyleparameter to see the dependency parsing result.
After firing up this code, you should see a response from displaCy as follows:

Figure 1.15 – Firing up displaCy locally
The response is added along with a link, http://0.0.0.0:5000, this is the local address where displaCy renders your graphics. Please click the link and navigate to the web page. You should see the following:
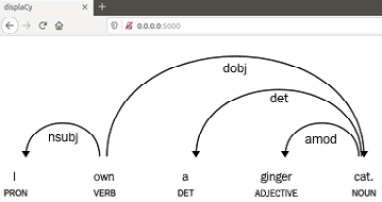
Figure 1.16 – View the result visualization in your browser
This means that displaCy generated a dependency parse result visualization and rendered it on your localhost. After you're finished with displaying the visual and you want to shut down the server, you can press Ctrl +C to shut down the displaCy server and go back to the Python shell:

Figure 1.17 – Shutting down the displaCy server
After shutting down, you won't be able to visualize more examples, but you'll continue seeing the results you already generated.
If you wish to use another port or you get an error because the port 5000 is already in use, you can use the port parameter of displaCy with another port number. Replacing the last line of the preceding code block with the following line will suffice:
displacy.serve(doc, style='dep', port= '5001')
Here, we provide the port number 5001 explicitly. In this case, displaCy will render the graphics on http://0.0.0.0:5001.
Generating an entity recognizer is done similarly. We pass ent to the style parameter instead of dep:
 import spacy
 from spacy import displacy
 nlp = spacy.load('en_core_web_md')
 doc= nlp('Bill Gates is the CEO of Microsoft.')
 displacy.serve(doc, style='ent')
The result should look like the following:
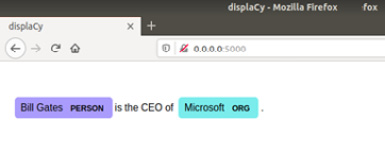
Figure 1.18 – The entity visualization is displayed on your browser
Let's move on to other platforms we can use for displaying the results.
Using displaCy in Jupyter notebooks
Jupyter notebook is an important part of daily data science work. Fortunately, displaCy can spot whether you're currently coding in a Jupyter notebook environment and returns markup that can be directly displayed in a cell.
If you don't have Jupyter notebook installed on your system but wish to use it, you can follow the instructions at https://test-jupyter.readthedocs.io/en/latest/install.html.
This time we'll call render() instead of serve(). The rest of the code is the same. You can type/paste the following code into your Jupyter notebook:
import spacy
from spacy import displacy
nlp = spacy.load('en_core_web_md')
doc= nlp('Bill Gates is the CEO of Microsoft.')
displacy.render(doc, style='dep')
The result should look like the following:
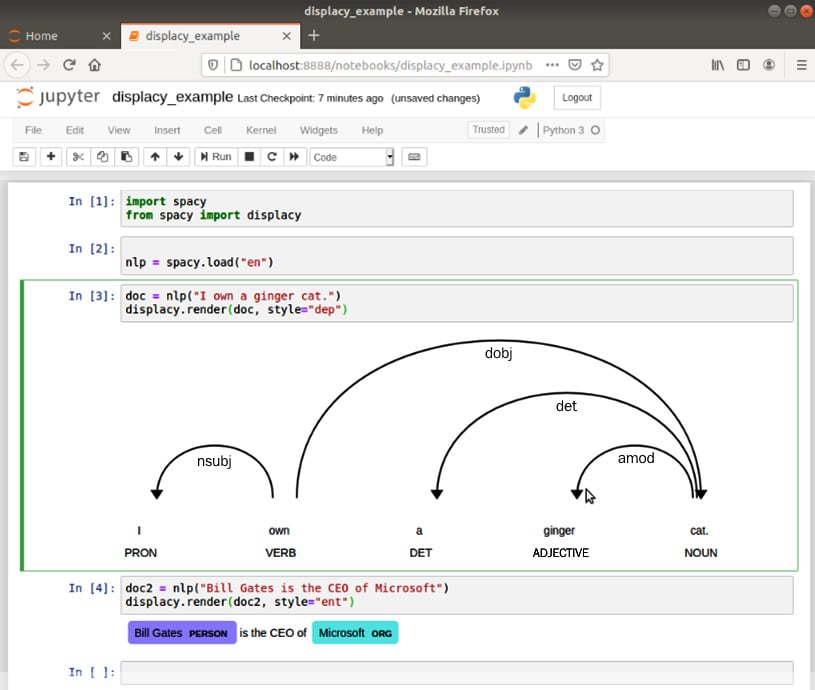
Figure 1.19 – displaCy rendering results in a Jupyter notebook
Exporting displaCy graphics as an image file
Often, we need to export the graphics that we generated with displaCy as image files to place them into presentations, articles, or papers. We can call displaCy in this case as well:
 import spacy
 from spacy import displacy
 from pathlib import Path
 nlp = spacy.load('en_core_web_md')
 doc = nlp('I'm a butterfly.')
 svg = displacy.render(doc, style='dep', jupyter=False)
 filename = 'butterfly.svg'
  output_path = Path ('/images/' + file_name)
 output_path.open('w', encoding='utf-8').write(svg)
We import spaCy and displaCy. We load the English language model, then create a Doc object as usual. Then we call displacy.render() and capture the output to the svg variable. The rest is writing the svg variable to a file called butterfly.svg.
We have reached the end of the visualization chapter here. We created good-looking visuals and learned the details of creating visuals with displaCy. If you wish to find out how to use different background images, background colors, and fonts, you can visit the displaCy documentation at http://spacy.io/usage/visualizers.
Often, we need to create visuals with different colors and styling, and the displaCy documentation contains detailed information about styling. The documentation also includes how to embed displaCy into your web applications. spaCy is well documented as a project and the documentation contains everything we need!


