Run Our Load Test and Analyze It
- Before launching our test, one last tip is to ask JMeter to generate an HTML report at the end.
For this, we will use the following command line:
<JMETER_HOME>/bin/jmeter -n -t [jmx file] -l [results file] -e -o [Path\ to output folder]
- Let's run our test and see what happens.
In our terminal:

Figure 1.30: Follows a load test in the terminal
- In Grafana (the dashboard used is one of those proposed in the Grafana website (https://grafana.com/dashboards/3351)):
Note
We can use this dashboard, too: https://grafana.com/dashboards/5496.

Figure 1.31: Real-time monitoring in Grafana

Figure 1.32: Real-time monitoring in Grafana
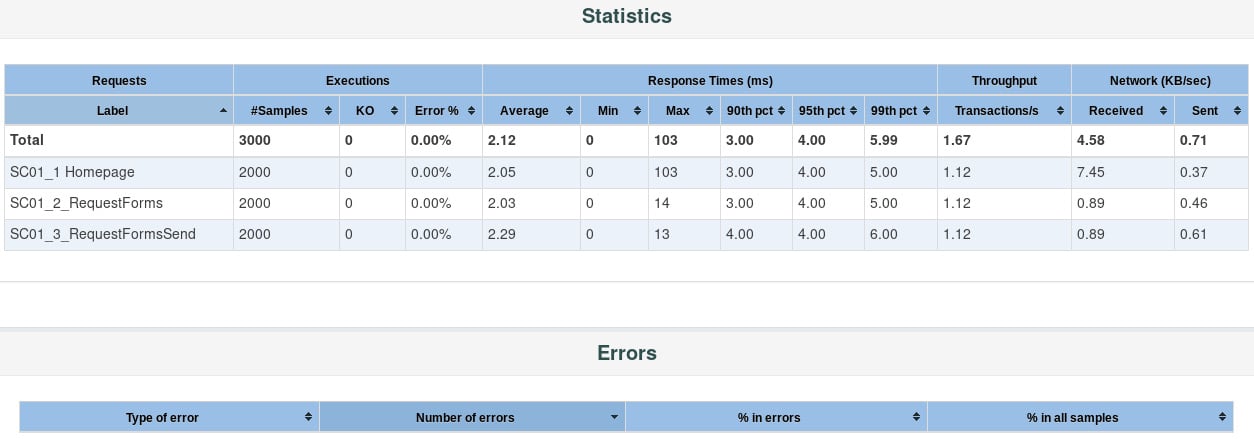
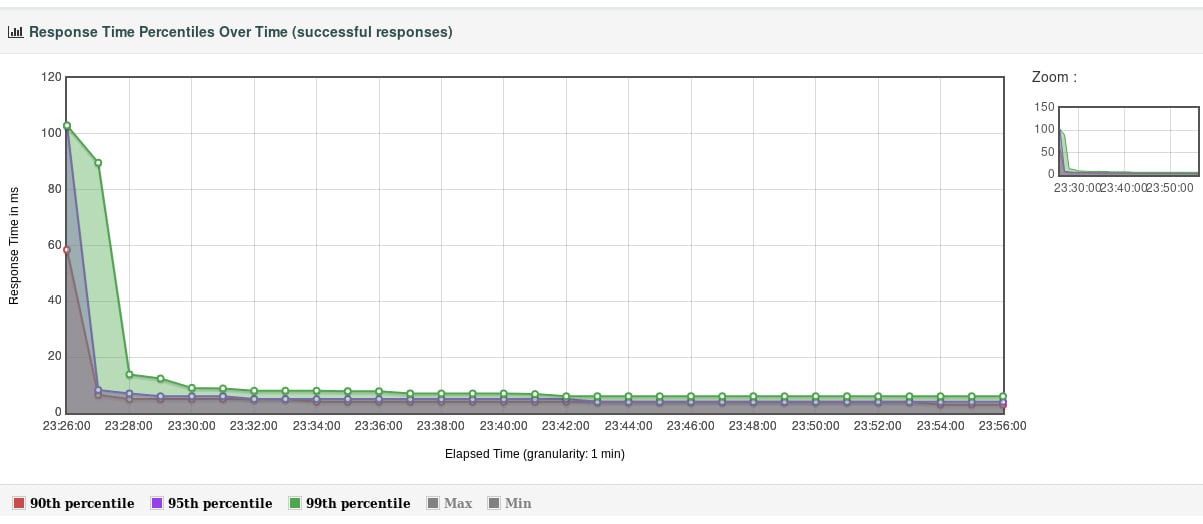
- At the end of our test, we get the HTML dynamic Web Report with 17 graphs, an APDEX (https://en.wikipedia.org/wiki/Apdex) table, a statistics table (showing response times, error rates, network metrics…), a table with an errors summary, and a table with Top5errors per sampler. So, you get everything you need to analyze your load test:

Figure 1.33: HTML report

Figure 1.34: HTML report
The icing on the cake is a CSV file we get at the end of our test; this format is usable by many tools to visualize the results differently.
In this chapter, we have seen how to quickly get started with JMeter to perform a simple load test.


